-

As the most comprehensive resource available for those involved in technology-based economic development, SSTI offers the services that are needed to help build tech-based economies. Learn more about membership...
-

Subscribe to the SSTI Weekly Digest
Each week, the SSTI Weekly Digest delivers the latest breaking news and expert analysis of critical issues affecting the tech-based economic development community. Subscribe today!
Useful Stats: GDP by County and Industry Contribution


This edition of Useful Stats examines the Bureau of Economic Analysis’ first full release of county-level gross domestic product (GDP) data. Specifically, this analysis considers total county GDP in 2018 and the contributions to each county’s GDP by industry.
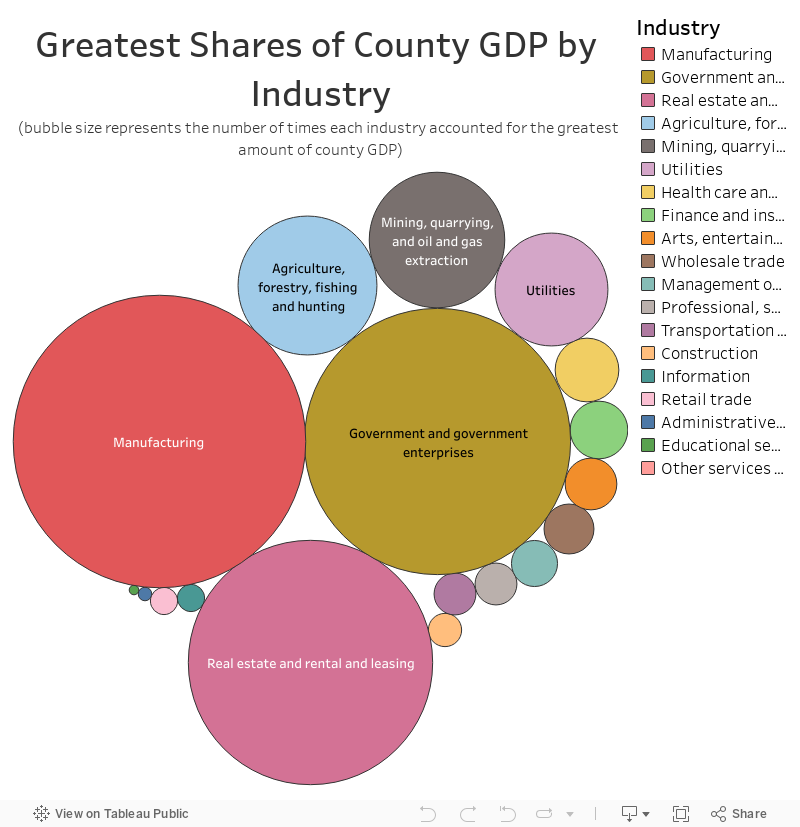
While finance and insurance in New York ($222.5 billion) accounted for the single largest contribution to both total county GDP and total U.S. GDP in 2018 — followed by real estate and rental and leasing in Los Angeles ($150.2 billion) — the manufacturing sector was the highest contributor to county GDP in the greatest number of counties. Manufacturing was the primary source for county GDP in 927 out of more than 3100 counties — accounting for nearly $2.3 trillion of total U.S. GDP in 2018. Government and government enterprises (768 counties) accounted for the second most frequent leader in county GDP contributions — totaling $2.4 trillion nationally — followed by real estate and rental and leasing (647 counties) — totaling $2.7 trillion nationally. The next closest industry was agriculture, forestry, fishing and hunting which was the top contributor to GDP in only 209 counties — and only accounting for a national total of $138.4 billion.
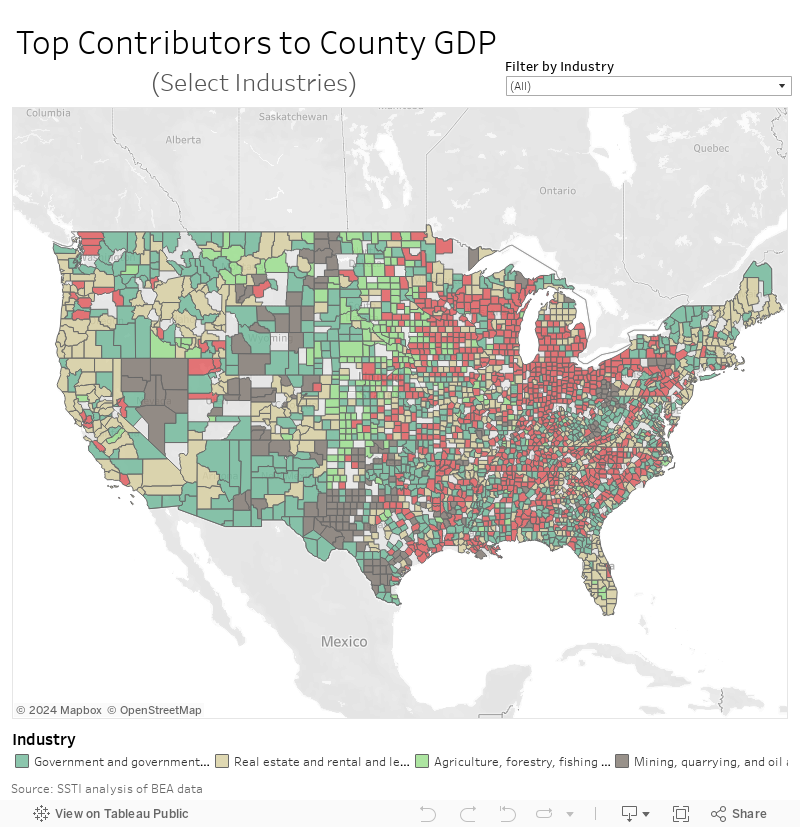
The map below shows counties with manufacturing, government, real estate, mining, and agriculture as their predominant industry. The map shows that manufacturing is the leading industry in counties in the Midwest and South while agriculture is centered primarily within the Plains region. Mining is clustered in west Texas, Nevada, western North Dakota, and the Appalachian region of Ohio, Pennsylvania, and West Virginia, with additional pockets of concentration spread through the Rocky Mountain Range. Real estate is concentrated on the coasts, specifically in the Pacific Northwest, Florida, and northern New England. Government is spread much more evenly across the country.
< >
Another way of visualizing the frequency of industry sectors by county is presented below.
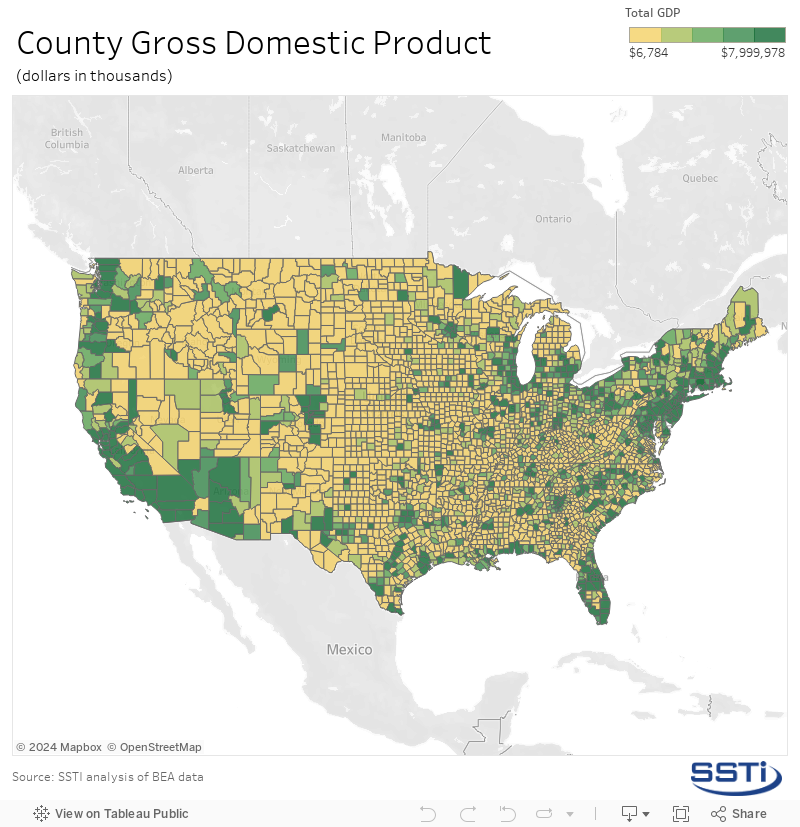
Los Angeles County ($787.2 billion) had the greatest output in 2018, followed by New York County ($709.8 billion), Cook County, Illinois ($412.3 billion), Harris County, Texas ($387.7 billion), and Santa Clara, California ($328.3 billion). As shown in the map below, other counties surrounding these top five also performed in the top 20 percent of the nation. The map also shows a general concentration of GDP in the greater coastal and southern California regions and along the east coast from northern Virginia through Massachusetts. Smaller concentrations can be seen in the Pacific Northwest, southern Florida, and along the Great Lakes coasts from Chicago through upstate New York.
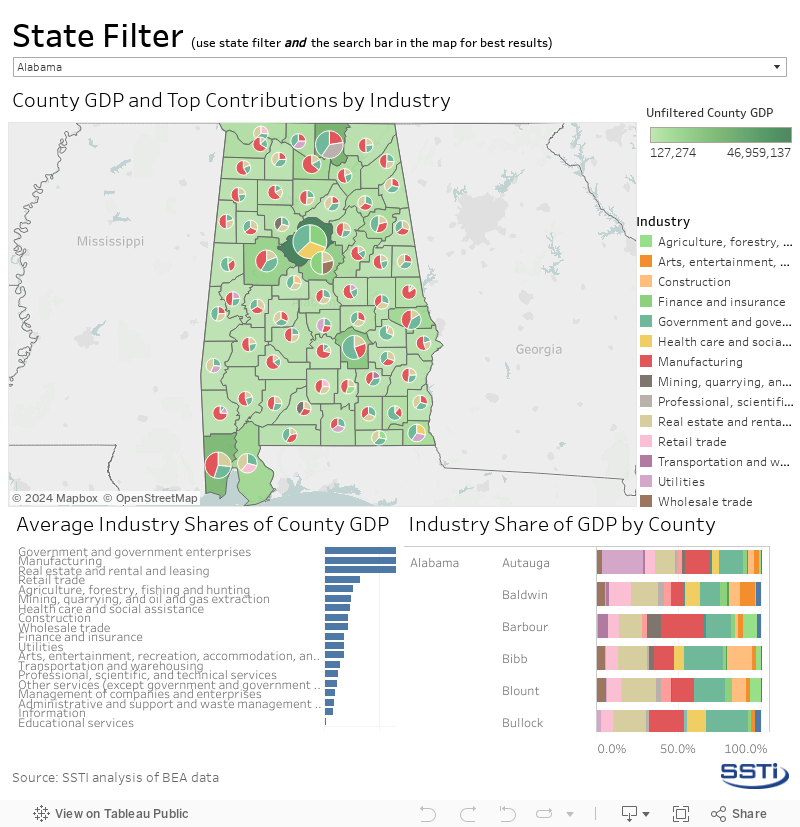
Averaged across all counties, government and government enterprises (17.4 percent), manufacturing (14.1 percent), and real estate and rental and leasing (13.5 percent) again topped the list for shares of county GDP. While these industries were not the primary GDP contributors in all counties, on average they were more heavily represented in every county. This information — as well as the top three industry contributors to county GDP and the full industrial GDP makeup for each county — is summarized in the interactive graphic below.
An excel file with the data can be accessed here.