

-

As the most comprehensive resource available for those involved in technology-based economic development, SSTI offers the services that are needed to help build tech-based economies. Learn more about membership...
-

Subscribe to the SSTI Weekly Digest
Each week, the SSTI Weekly Digest delivers the latest breaking news and expert analysis of critical issues affecting the tech-based economic development community. Subscribe today!
Useful Stats: R&D personnel by state and metro area


Across the nation, R&D at colleges and universities plays an important role in generating promising inventions, training our STEM talent pipeline, and supporting regional economic development. An SSTI analysis of National Science Foundation data finds that higher-education R&D (HERD) is a multi-billion dollar industry that directly employs nearly one million personnel on projects and grants in the United States. However, the locations of R&D projects and personnel differ greatly by state and region.
There are approximately 930,000 R&D personnel at colleges and universities in the United States, according to the NSF HERD Survey. Of this amount, roughly 17.5 percent are considered “principal investigators”, which means they are “designated by the institution to direct the R&D project or program and be responsible for the scientific and technical direction of the project.” The remaining 82.5 percent includes all other personnel, students, and post-docs paid from R&D accounts, regardless of the amount they received. Each individual counts only once, and if a person serves as a PI or co-PI on one project and as support on another project, they are counted as a PI. The map below shows total R&D personnel by state and metropolitan area.
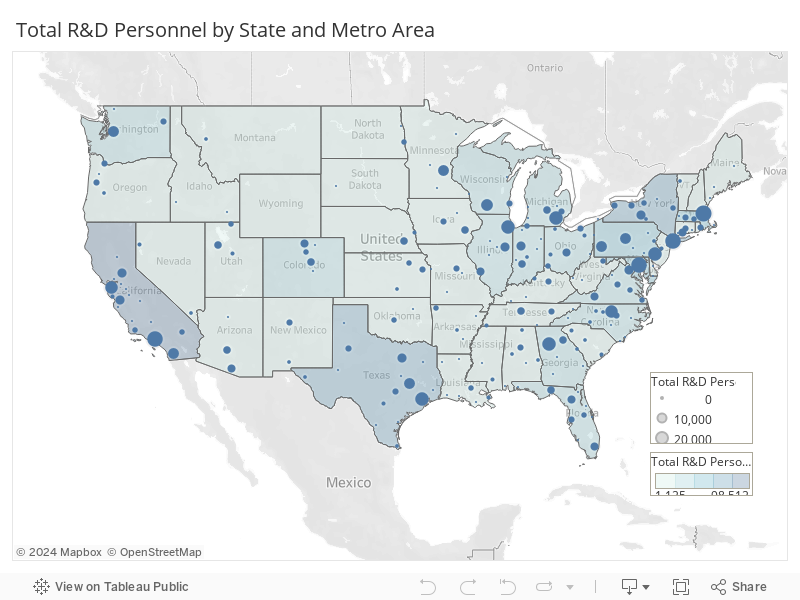
In terms of absolute numbers, R&D personnel tend to cluster on the coasts, while large research universities harbor principal investigators. Five of the 10 metropolitan areas with the most HERD personnel are in the Northeast, led by New York (40,349), Boston (34,562), and Baltimore (30,414). Other metros with a high number of personnel include Los Angeles, Chicago, Houston, Atlanta, and Ann Arbor. Meanwhile, five of the 10 universities with the most principal investigators are in the Midwest, led by Michigan, Penn State, Wisconsin, Minnesota, and Ohio State. Other universities ranking in the top 10 of total principal investigators include Johns Hopkins, Texas A&M, Colorado State, Washington, and UCLA.
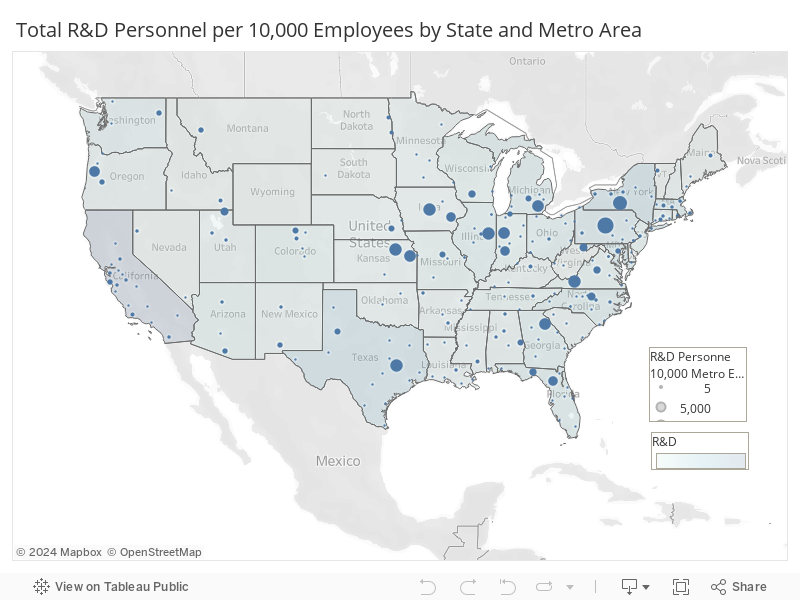
In many regions outside of the coasts – including traditional college towns and formerly industrial metros — R&D personnel make up a large share of the workforce. The map below shows R&D personnel per 10,000 state and metropolitan residents. R&D personnel make up the largest share of total employment in the State College, Pennsylvania (2,677 personnel per 10,000 total workers); Ithaca, New York (2,023 personnel); and Ames, Iowa (1,771 personnel) metropolitan areas. Of the largest 100 metropolitan areas, R&D personnel make up the largest share of total employment in Durham (707 personnel per 10,000 total employees), Madison (546 personnel), and Spokane (288 personnel). Several large regions known for their industrial history also rank highly for their R&D personnel per capita, including Pittsburgh(135 personnel per 10,000 total employees), Rochester (123 personnel), Birmingham (112 personnel), and Buffalo (103 personnel).
This analysis of data from the HERD survey and other sources suggests that funds for higher education R&D are important to regional economic development for three main reasons.
First, the data underscores the importance of R&D as a “traded industry.” More than half (54 percent) of the $72.0 billion in research and development performed by colleges and universities came from the federal government. Although institutional funds (16 percent) make up the second largest source of funds, businesses, nonprofit organizations, and state and local governments each represent roughly 6 percent of the total. Because the vast majority of funds for R&D in a given region come from elsewhere, understanding the economic geography of R&D helps contextualize the value of higher education R&D as a “traded” good.
Second, higher education R&D helps build the STEM pipeline. R&D is, by nature, STEM intensive — approximately 95 percent of HERD is in science and engineering fields, and nearly one-third of all HERD spending is in the health sciences. A UMETRICS analysis of workers supported by some of the largest research projects from the U.S. Department of Health and Human Services and NSF finds that the majority of personnel are somewhere in the training pipeline, defined as undergraduate, graduate, or postdoctoral students. These workers are likely to remain located near their research university after graduating, the authors find.
Third, R&D grants pay for people, not things. Overall, roughly 57 percent of all R&D expenditures went toward salaries, wages, and fringe benefits. Other direct costs, which includes services such as consulting and computer usage fees, travel, and tuition waivers for undergraduate and graduate students, represent 28.6 percent of total HERD costs, the second highest cost category for R&D grants at universities. Although just four percent of R&D expenditures went toward purchasing equipment and software, UMETRICS research finds that this spending also contributes to economic development, because these purchases are more likely to be made near the university.
Although the extended data shows that many large metropolitan areas are lacking when it comes to R&D personnel, these regions are hardly doomed. For example, commuter sheds are often larger than the core-based metropolitan statistical area level, the selected unit of analysis for this research. In reality, the overlap between regions like Indianapolis and Bloomington, or Detroit and Ann Arbor, is quite strong.
Additionally, the data does not include other important research institutions such as private R&D labs and research hospitals. Industry remains the largest funder and performer of R&D in the United States, and as a result, employs the most R&D personnel. Those individuals are not included in this analysis. Similarly, employment for research hospitals, like Mayo Clinic and Cleveland Clinic, are not included in this analysis. For regions like Cleveland and Rochester, Minnesota, the actual counts of “academic” R&D personnel are likely much higher.
Finally, HERD analysis places all R&D personnel at the location of the university. While the data acknowledges branch campuses separately, there are multiple instances of urban areas successfully leveraging the R&D assets of nearby research universities. For example, Greenville, South Carolina, is home to the Clemson University International Center for Automotive Research (40 miles away). Roanoke, Virginia, is home to the Virginia Tech Carilion School of Medicine and Research Institute, located 42 miles from the school’s main campus in Blacksburg. Many of Michigan State University’s medical and biological engineering facilities are located in Grand Rapids, just over 70 miles away from the main campus in East Lansing.
The placement of new research facilities — and in particular, medical schools — has real economic development implications. Cities like Austin, Texas; Augusta, Georgia; and Tyler, Texas; have built research-focused medical schools in recent years. These schools have brought grants for R&D, but more importantly, hundreds of people. The Van Andel Institute in Grand Rapids and the Indiana Biosciences Research Institute in Indianapolis represent research institutes with considerable private sector and philanthropic backing.
Furthermore, the role of state and regional level policies that can increase the levels of R&D personnel in a region, especially the number of principal investigators, are worthy of additional attention. Eminent scholar programs are one such an example. In some states with eminent scholar programs, such as South Carolina and Ohio, principal investigators represent a large share of total R&D personnel. In others, like Georgia or Texas, the principal investigators have a considerable ripple effect, with large amounts of PI’s but also many other personnel supporting those efforts. More research is needed to determine whether the attraction of strong principal investigators to a regional economy may be able to encourage follow-on employment throughout the university. The chart below shows this “ripple effect” for each state.
While considerable attention is paid to the unevenness in venture capital, perhaps more should be paid to the geography of federal investments in R&D. Programs like EPSCoR that were originally intended to drive more federal R&D expenditures to smaller states are worthy of additional attention. More efforts like this are needed to ensure that smaller states and regions have access to R&D grants, and in turn, high-skill personnel.
Finally, this analysis shows that investments in research and development have a real impact on the types of employment in a region. For states and metropolitan areas, there is a need to ensure that federal support for the innovation enterprise continues, and if possible, increases. This could have profound impacts on the innovation economy at both the macro- and micro-levels.
useful stats, higher ed, r&d, research, stem