Based upon the finding of two reports – the 4Q Pitchbook-NVCA Venture Monitor and the MoneyTree Report – SSTI identified three significant trends that impact the startup capital community: geographic concentration, mega-rounds/funds, and strong VC-backed exit activity.
Approximately $130.9 billion was invested across nearly 9,000 deals in 2018 by the venture capital (VC) industry, according to the 4Q PitchBook-NVCA Venture Monitor. This marks the first year since the height of the dot-com boom that annual capital investment eclipsed $100 billion. The report indicates a decline in the number of seed-stage deals made during the year, although PitchBook will continue to add deal data as it becomes public, which may ultimately change the direction of this trend (as happened in 2017).
Reporting on seed-stage investments as a share of all deals, the MoneyTree Report from PricewaterhouseCoopers and CB Insights finds a third consecutive year of decline, to just 25 percent in 2018. The year did see more large, later-stage, mega-rounds including a record number of 54 VC-backed U.S. companies obtaining $1 billion valuation — a record for the number of new unicorns.
In the MoneyTree Report for 4Q of 2018, there was a clear concentration of dollars going to two metros — San Francisco and New York. VC-backed companies located in San Francisco saw historical funding levels due to a 55 percent jump in 2018 to $28 billion, from $18 billion in 2017. In New York, funding increased from $12 billion in 2017 to $13 billion in 2018. Much of the increases in funding for VC-backed companies in these two metros related to the trends of mega-rounds and the growth of unicorns that cluster around those regions.
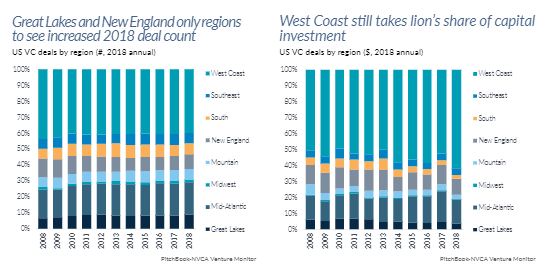
On the regional level, NVCA and PitchBook report that only the Great Lakes Region and New England saw an increase in the number of deals, while the West Coast expanded its dominance in dollars attracted. This concentration was again driven mostly by a record number of mega rounds in 2018, and that trend may continue in 2019 with NVCA and PitchBook predicting an “arms race” for megadeals that potentially could concetrate the VC markets even more.
In 2018, PwC and CB Insights report 184 mega-rounds (rounds of $100 million or more). In both reports, researchers contend that these mega-rounds were a major driver of the declines in seed stage deals as well as the concentration of funds invested to San Francisco and New York City. One driver of the mega-rounds was record highs in the number of mega-funds. In 2018, mega-funds ($500 million or more under-management) in new capital accounted for 57 percent of all capital raised. Both of these trends should continue in 2019 and potentially beyond.
Finally, VC-backed exits were strong in 2018 with more than $120 billion exited across 864 exits. This was a 33 percent year-over-year increase in terms of exit value and a slight increase in the number of exits from 2017. The exit numbers were driven by both IPOs and M&A activity. VC-backed IPOs increased in both count and liquid value exited. This is in the number of tech IPOs may mark the beginning of a long-awaited influx of VC-backed companies in the public markets. It also marks the most VC-backed companies to enter the public markets since 2014.