

As the most comprehensive resource available for those involved in technology-based economic development, SSTI offers the services that are needed to help build tech-based economies. Learn more about membership...

SSTI analysis reveals SBIR “mills” take outsized portion of the program’s awards
SBA efforts to reign in abuse of the Small Business Innovation Research and Small Business Technology Transfer (SBIR/STTR) program continue, yet companies that seem to use SBIR awards as a primary revenue stream rather than a means to creating future revenue paths through new product and process innovations persist, based on SSTI’s review of award data. Known as “SBIR mills” many of these companies appear to be clustered geographically in specific metropolitan areas, many of which house major federal labs or research centers, the analysis of SBIR data reveals. This suggests, from a policy perspective, that the federal agencies could be doing much more to curtail the mills and redirect awards into companies more consistently focused on turning innovation into products, profits and jobs.
The data reveals the extent of abuse by the small number of SBIR mills among all awardees is not insignificant: awards made to potential mills account for more than 21 percent of all awards made during the period from 2009 to 2019.
Using SBA data, SSTI identified 13,046 different companies from among the more than 63,000 awards made from 2009 to 2019. Of these companies, 0.7 percent (95 companies) won 40 or more Phase I awards and/or 30 or more Phase II awards — qualifying these companies as possible SBIR mills based on the federal program’s stated performance benchmarks (the rate of Phase I to Phase II transition and commercialization success). All 11 of the participating federal agencies agreed to these SBA-established benchmarks in 2014.
The balance of the 63,000 SBIR grants and contracts awarded during the time period were distributed among the 1.5 percent of winners (199 companies) that won between 20 and 39 awards each, the 56 percent of winners (7305 companies) that won between two and 19 Phase 1 awards, and the 41.5 percent (5,415 companies) that received only one award. As seen in the interactive map below, companies that qualify for evaluation as an SBIR mill are mapped with red dots that are sized according to the total number of awards won by the firm.
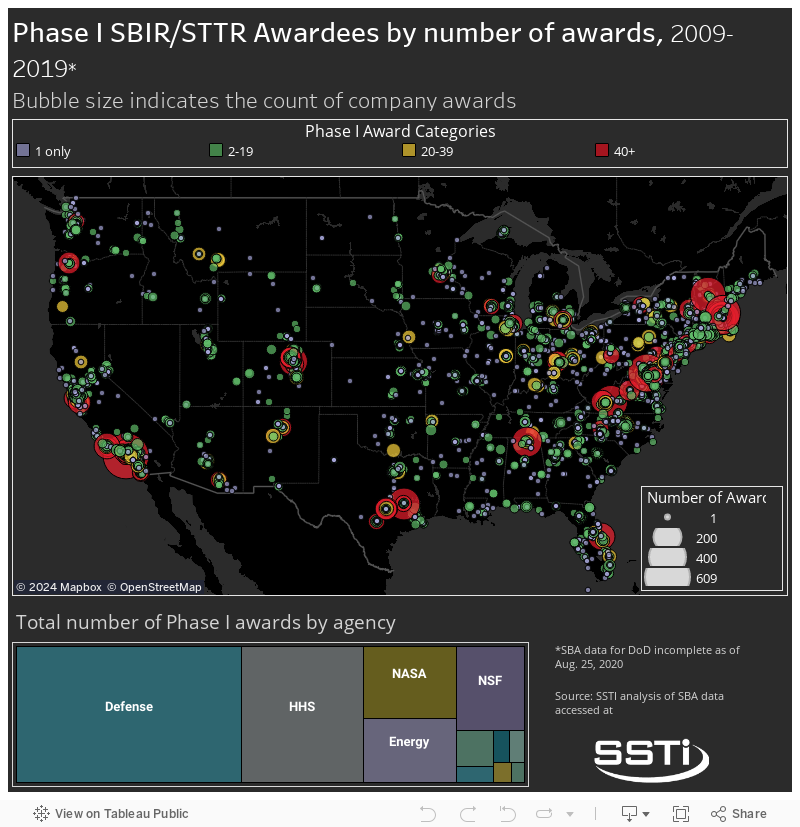
As the map shows, many of the companies that won the most Phase I awards — represented by larger dots on the map — are clustered in the biggest population centers of New York, Los Angeles, Chicago and Houston. R&D-intensive Boston also has a cluster of repeat SBIR performers. A second group of locations with potential SBIR mills include several metropolitan areas housing or in close proximity to major DOD, DOE and/or NASA research centers: Denver, Colo.; Cincinnati, Ohio; Huntsville, Ala.; Santa Fe, N.M.; Portland, Ore.; Seattle Wash.; and, Titusville, Fla.
Clustering of small R&D firms and SBIR awards around federal research installations would be expected; the mission-oriented defense, energy and space agencies and their large contractors are the most likely customers for any technology resulting the SBIR work. The close proximity of so many potential SBIR mills to their awarding federal labs implies the agencies are aware of, and continuing to support these particular companies despite the program’s purpose and performance goals.
Shifting the focus to the distribution and concentration of Phase II awards reveals a similar narrative can be told, as shown in the map below.
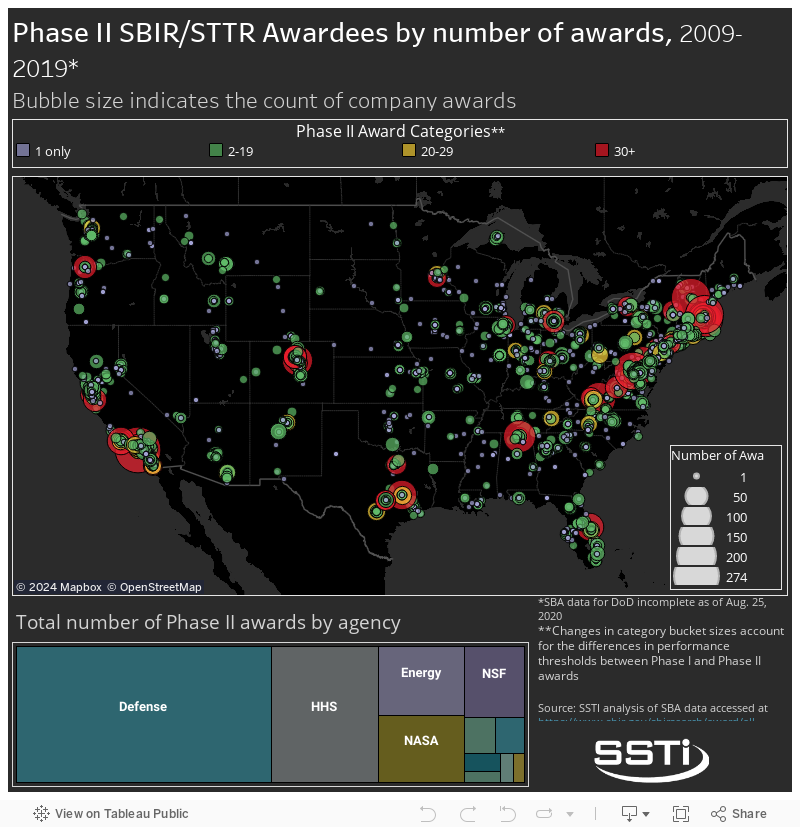
Both maps above also show that companies that received more than 20 awards and less than the threshold of the 30 Phase II awards that require that the company be consideration as an SBIR mill, are similarly clustered in these metropolitan regions. Indeed, most of the companies that won any award at all are relatively clustered in these same metros, as can be seen in the following close-ups of the Southwest and New England regions.
Comparing these maps to similar visualizations of the state and local distributions of R&D investments by institutions of higher education, private industry, and the share of science and engineering degrees across states, provides a broader view of how many of the critical elements required for productive entrepreneurial and innovative economies are distributed across the country. In each of these categories, the New England and Mid-Atlantic and the Coastal West regions dominate, with inland activity concentrated around larger metropolitan areas and other metros linked with university- and/or industry-specific clusters.
While the increased presence of potential SBIR mills is associated with this metropolitan clustering of innovation assets, understanding the nature of these individual firms is more difficult. Public data is not available on how SBIR companies perform against the performance benchmarks the agencies agreed to use in making future awards to past winners. These metrics are self-reported by companies and supplemented by the awarding agencies. The data raises questions on how effective enforcement of the commercialization success rule is. SBA is reportedly reevaluating the rule and how it is implemented.