Building on SSTI’s recent analysis of county-level GDP by industry, this edition moves beyond a single year and examines the changes in real — adjusted for inflation — county GDP and the changes in industry-specific contributions to county GDP for the 10-year period from 2009 to 2018. As shown in the interactive map below, the total 10-year growth rate for counties averaged approximately 21 percent.
All 10 of the counties that experienced the greatest percentage increases in total GDP between 2009 and 2018 are in Texas. The increases for these top 10 counties ranged from 709 percent to more than 3000 percent. The growth in most of these counties was driven by dramatic increases in the mining industry and related activities such as transportation and utilities.
Expanding this analysis to include the top 100 counties out of the total 3116, Texas is represented 31 times, followed by Nebraska (10 times), and North Dakota (seven times), Ohio (seven times), and Oklahoma (seven times) tied for third. The GDP increases for these 100 counties ranged from 90.6 percent to more than 3000 percent. Other notable areas of increase include the Ohio-Pennsylvania-West Virginia border region, and several central U.S. pockets in Oklahoma, Nebraska and the Dakotas. As in Texas, the concentrated high growth seen in Appalachia and the Dakotas was also driven primarily by mining and related activities, while growth in the central Plains states was primarily a result of increased agricultural activity.
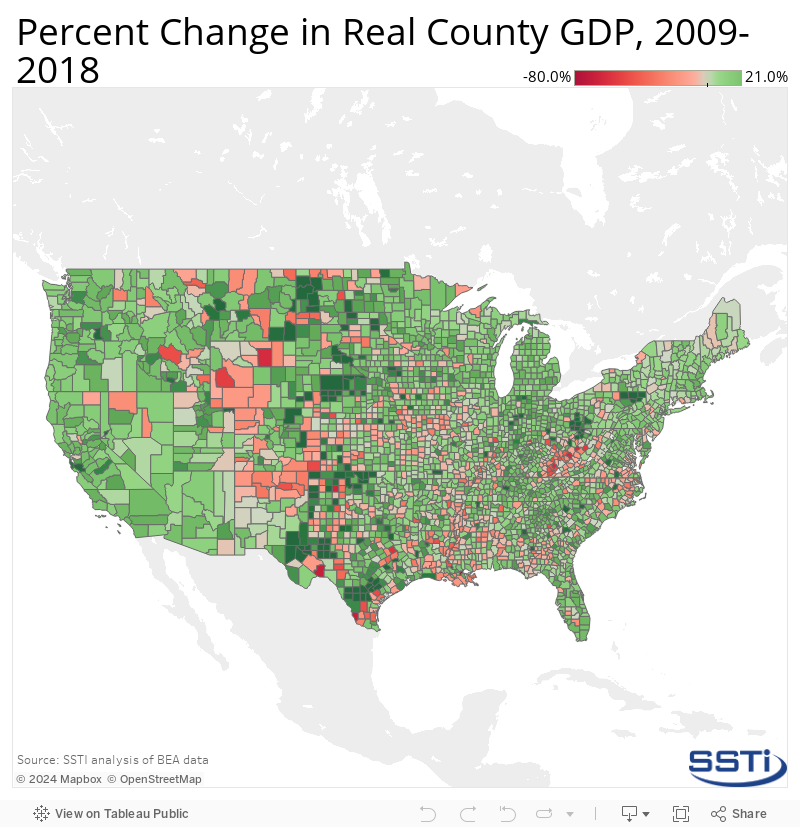
However, the map also shows that some counties experienced a decline in GDP, with several dropping by nearly 80 percent over the period. The areas of greatest decrease are found from northern New Mexico through the Great Plains region to Wyoming, and the Appalachian region of Kentucky, West Virginia and Virginia. As more clearly seen in the image below, it is also notable that several of the areas suffering from steep decreases in GDP — such as the Appalachian region, south Texas, and northern New Mexico — are located in direct proximity to the regions that experienced the greatest increases. Specifically, in the cases of northern New Mexico, south Texas, and the Kentucky-West Virginia-Virginia border area of Appalachia, the steep declines in GDP have been driven by the same industry that spurred such drastic increases in neighboring areas; mining.
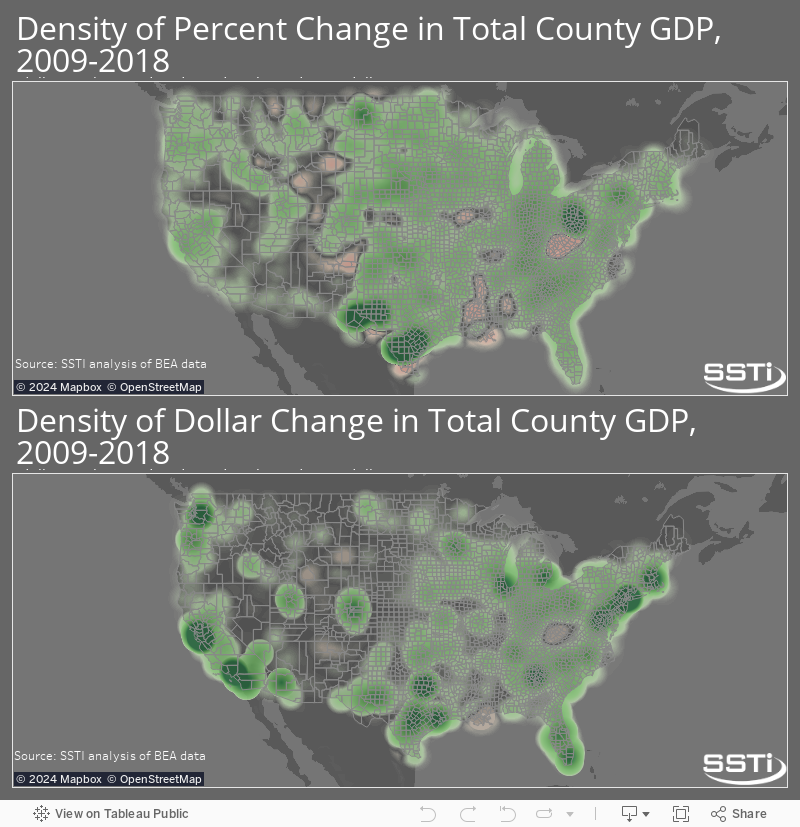
The image above also shows that there are some distinct differences between the distribution of percentage (top map) increases and the total dollar (bottom map) amount increases. While south and west Texas are still relatively strong clusters for total dollar increases in GDP per county, the coastal hotspots for economic activity show the greatest concentration of increases. The New York and Boston areas in the Northeast, Miami and Houston in the South, and the Los Angeles, San Francisco, and Seattle areas in the West are the most concentrated in terms of total dollar increases in area GDP.
Specifically, the 10 counties that experienced the largest 10-year increase in total GDP are Santa Clara ($157.9 billion), Los Angeles ($146.4 billion), New York ($122.8 billion), King County in Washington ($100.9 billion), San Francisco ($68.4 billion), Dallas ($62.5 billion), Harris County in Texas ($55.9 billion), Orange County in California ($49.7 billion), San Diego ($47 billion), and Maricopa County in Arizona ($46.9 billion).
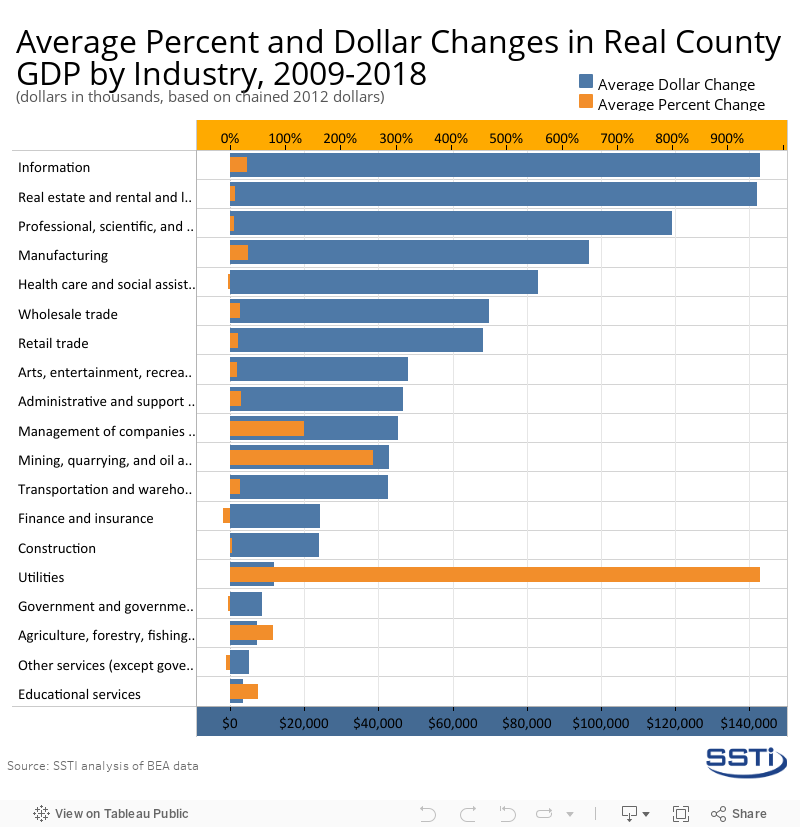
The chart below provides some insight into what industries are driving the dynamics examined above. The blue bars indicate the average total dollar growth in county GDP for each of the selected industries — mapped to the lower axis — while orange bars indicate the average total percent growth in industries’ county GDP over the period — mapped to the upper axis. There does not appear to be any correlation between growth in real dollar amounts and the percent growth. That is, just because an industry saw a greater total dollar increase than other industries, does not mean it also experienced the same rate of growth and vice versa. For example, information, real estate and professional/scientific services saw relatively large dollar increases — ranging from $370 billion (professional services) to $445 billion (information) — but only saw growth rates in the 6.6 percent (professional services) to 30 percent (information) range. In comparison, utilities and mining experienced enormous growth rates of more than 260 percent (mining) and 900 percent (utilities), they only grew in the real dollar amounts of $133 billion (mining) and $37 billion (utilities) over the same period. The industries that saw the greatest dollar increases also tended to be located in areas and counties that already have higher levels of GDP, whereas industries like mining and manufacturing grew faster in more rural and sparsely populated areas that historically experience lower levels of GDP.
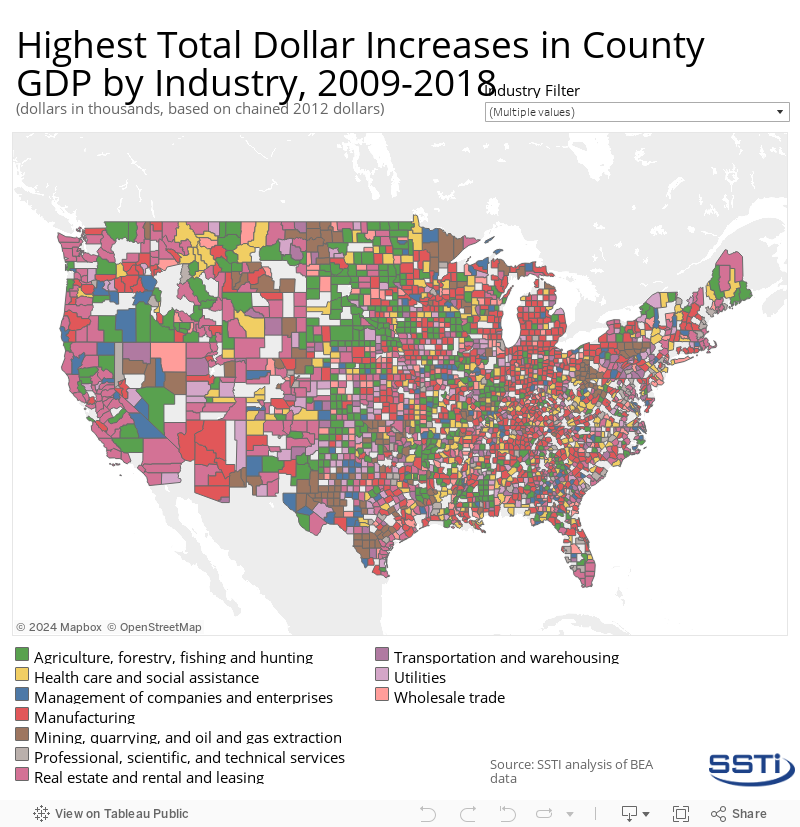
The interactive map below provides insight into this clustering of top performing industries per county. Manufacturing contributed to the greatest total dollar increases to county GDP in the most counties (740), with concentrations in the Midwest/Great Lakes region and other pockets scattered around the South, New England, and Southwest, and the Pacific Northwest. Agriculture contributed to the second most number of counties (418) with most of that activity taking place in the Great Plains and western edge of the Midwest and other pockets in the Alabama, Arkansas, and southern Illinois. Real estate contributed to the third most number of counties (394) and is concentrated primarily in the Rocky Mountain Range and western states.
An excel file with the data can be accessed here.