This edition of Useful Stats presents an SSTI analysis for the number of SBIR/STTR awards from 2011 to 2020 (the most recently available complete data), examining which agencies make the most awards in each state and how each state’s composition of awards compares to the national profile.
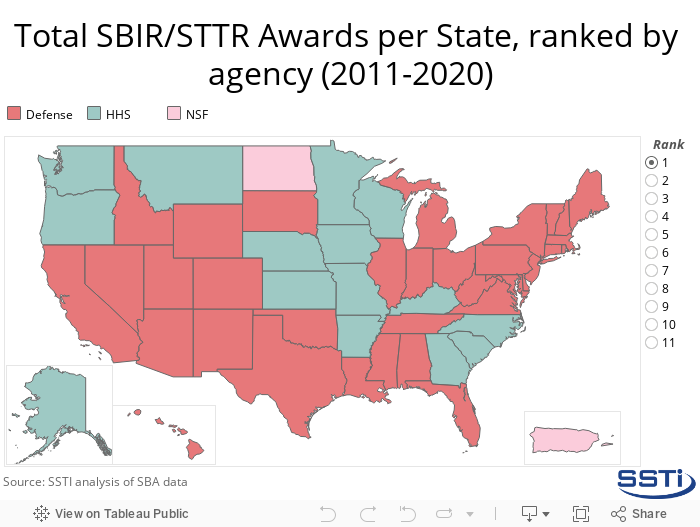
Two federal agencies made the greatest number of SBIR/STTR awards in nearly every state. The U.S. Department of Defense (DoD) accounted for the greatest number of SBIR/STTR awards in 35 states (including the District of Columbia), growing from 29 states as identified in a previous SSTI analysis for the 10-year period from 2009-2018. The U.S. Department of Health and Human Services (HHS) made the most awards in 15 states over the 10-years from 2011 to 2020, decreasing from the 22 states for the previously examined 10-year period, while the National Science Foundation made the most total awards in two states/territories for the combined 10-year period from 2011 to 2020.
Viz-Tip: Use the “Rank” selector in the interactive map below to see how agencies ranked in terms of the total number of SBIR/STTR awards made in within each state over the combined 10-year period from 2011 to 2020.
SSTI examined how the agency shares of total SBIR/STTR awards made within each state over the 10-year period from 2011 to 2020 state stacked up against the national total. The table below shows where the agency shares of the total number of SBIR/STTR awards made within states was above and/or below the national total. If the share of total awards made over the period within a given state was above the national total, the agency share is shaded green. It is shaded red if it was below the national total.
Additionally, the right column in the table below indicates how many agencies accounted for more than their national share of total of SBIR/STTR awards made within each state. The darkest green shading in this column indicates states with the most agencies making an above-average number of awards, and the darkest red shading indicates the states with the fewest agencies making an above-average number of awards. For the combined 10-year period from 2011 to 2022, the states with the greatest number of agencies making awards in larger shares than the national share were Arkansas and Indiana (eight agencies each), and the states with the least number of agencies making an above-average number of awards were Arizona (two agencies), Nevada (two agencies), New Jersey (two agencies), and Rhode Island (one agency).
Considering a state’s trends in the distribution of SBIR awards by federal agency may help policy makers and others in the innovation community optimize the design and performance of regional support for innovation-based startups. For example, the relative concentration of agency SBIR/STTR awards in states can have implications for policy makers and program leaders in how their entrepreneurial support programs conduct marketing and outreach efforts and recruit the right mix of mentors and knowledge assets to a program’s technical assistance capabilities.
Click here for the data used in this article.