A large majority (nearly 87 percent) of U.S. counties showed growth in their gross domestic product (GDP) from 2018 to 2019, according to an SSTI analysis of data from the U.S. Bureau of Economic Analysis (BEA). GDP is the measure for the total value of goods and services produced in an area, and is one of the primary economic indicators used by researchers and policymakers. This edition of Useful Stats examines the recently updated (BEA) data and provides an analysis of 2019 total county GDP, 2019 county GDP per capita, and the percent change in each measure from 2018 to 2019.
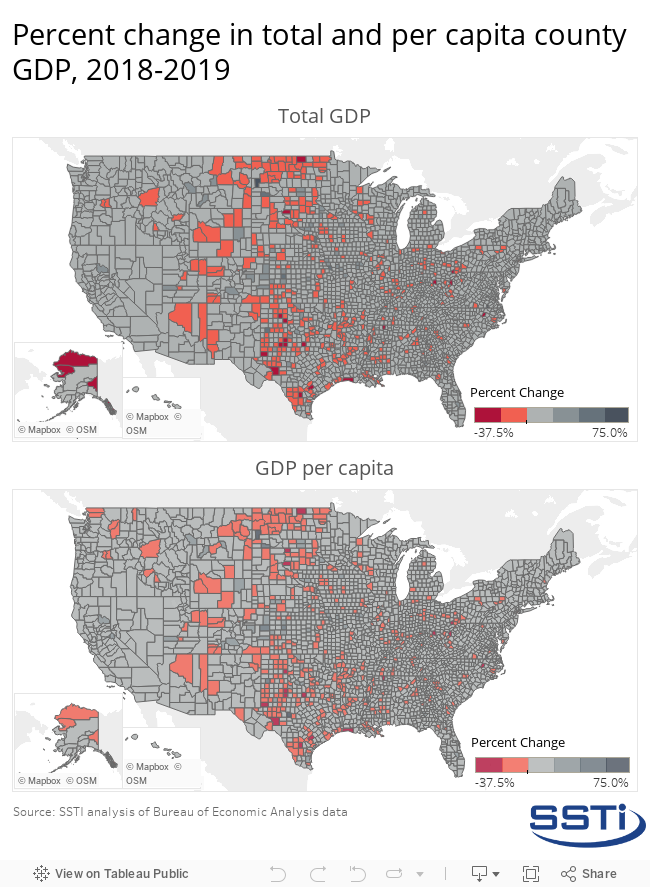
The maps below show the percent changes in total county GDP (top) and county GDP per capita (bottom) from 2018 to 2019. Greensville County in Virginia experienced the greatest growth in total GDP (66 percent); followed by Billings County, North Dakota (60.2 percent); Holt County, Missouri (52.8 percent); Adams County, North Dakota (46.9 percent); and Sheridan County, Kansas (43.7 percent). While nearly 87 percent of U.S. counties experienced growth in total GDP, some counties experienced reductions in 2019 economic output compared to 2018 as indicated in shades of red in the maps below. The counties that experienced the greatest declines were Jackson, West Virginia (-33.9 percent); King County, Texas (-24 percent); Crockett County, Texas (-23.7 percent); Wheeler County, Texas (-22.2); and Nash County, North Carolina (-22.2 percent).
As seen in the second map, the counties with the greatest growth in GDP per capita in 2019 were Greensville County in Virginia (68 percent); Billings County, North Dakota (64.4 percent); Concho County, Texas (62.7 percent); Holt County, Missouri (53.6 percent); and Adams County, North Dakota (49.4 percent). The counties that experienced the greatest reductions in 2019 economic output compared to 2018 were Jackson County, West Virginia (-33.6 percent); McMullen County, Texas (-31.9 percent); King County, Texas (-26.9 percent); Stonewall County, Texas (-24.9 percent); and Nash County, North Carolina (-22.2 percent).
In 2019, total GDP was concentrated heavily in counties along coastal New England, Florida, and California. As seen in the first map below, most of the rest of the counties in the U.S. had relatively lowers levels of economic output, save a few counties in each state containing or surrounding metropolitan areas. Los Angeles County had the highest economic output of all counties in 2019, with $820.5 billion in total GDP. New York County, New York ($769.5 billion) came in second; followed by Cook County ($425.6 billion) in Illinois; Harris County, Texas ($412.6 billion); and Santa Clara ($331.9 billion) in California. However, total GDP does not provide the full picture because these counties with high economic output also have large populations.
In the second map, GDP is standardized by county population.
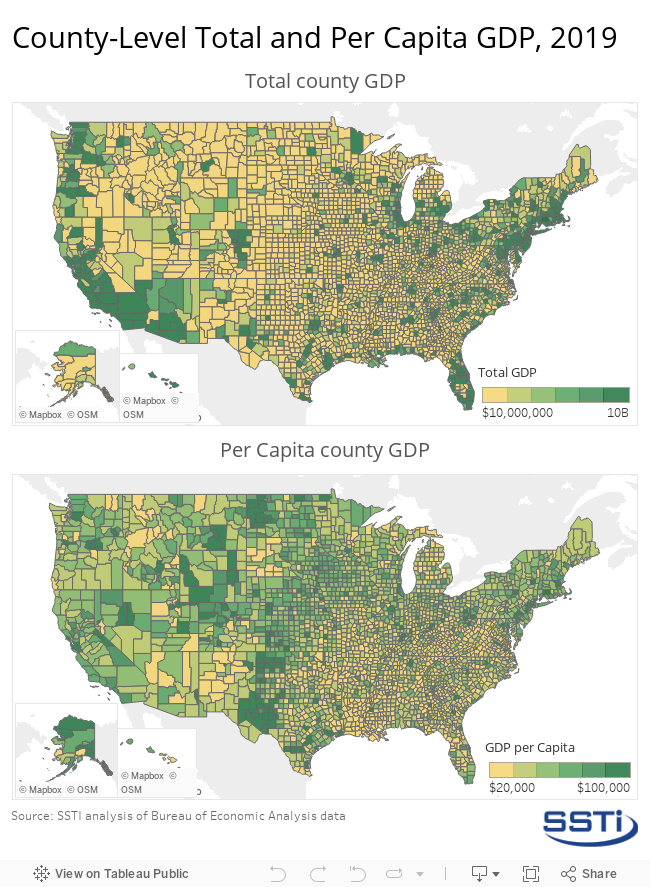
The second map shows that county GDP per capita is more evenly distributed throughout the U.S. — although some areas of concentration still exist along the Atlantic Coast, west Texas, and in the central states. One can presume counties that exhibit higher levels of total GDP and per capita GDP are generally well-off and counties that exhibit lower levels of both GDP metrics are generally poorer, but understanding the economies of counties high in only one measure of GDP or the other is not as simple.
Total GDP may indicate the power of economies of scale achievable in densely populated areas, but may also give the wrong indication of the population’s overall wellbeing, while GDP per capita can provide more insights into these nuances. Some counties with very low populations and anchor industries may be overemphasized using GDP per capita. For example, the sparsely populated Loving County in west Texas recorded the highest GDP per capita of $47.9 million in 2019. Yet there were less than 100 people living in the county in 2019 which is home to a highly productive mining and oil and gas extraction operation.
Click here to access the SSTI spreadsheet use for this analysis.