

As the most comprehensive resource available for those involved in technology-based economic development, SSTI offers the services that are needed to help build tech-based economies. Learn more about membership...

Useful Stats: Federal R&D obligations by state and agency, 2019
The level of federal R&D funding within a state can have important implications for local innovation economies. As such, understanding the amount of federal R&D funding and which agencies provide that funding within a state can help regional innovation leaders in designing and implementing programs and policies. This edition of Useful Stats explores NSF’s recently updated data on federal R&D funding obligations in 2019 by state and agency.
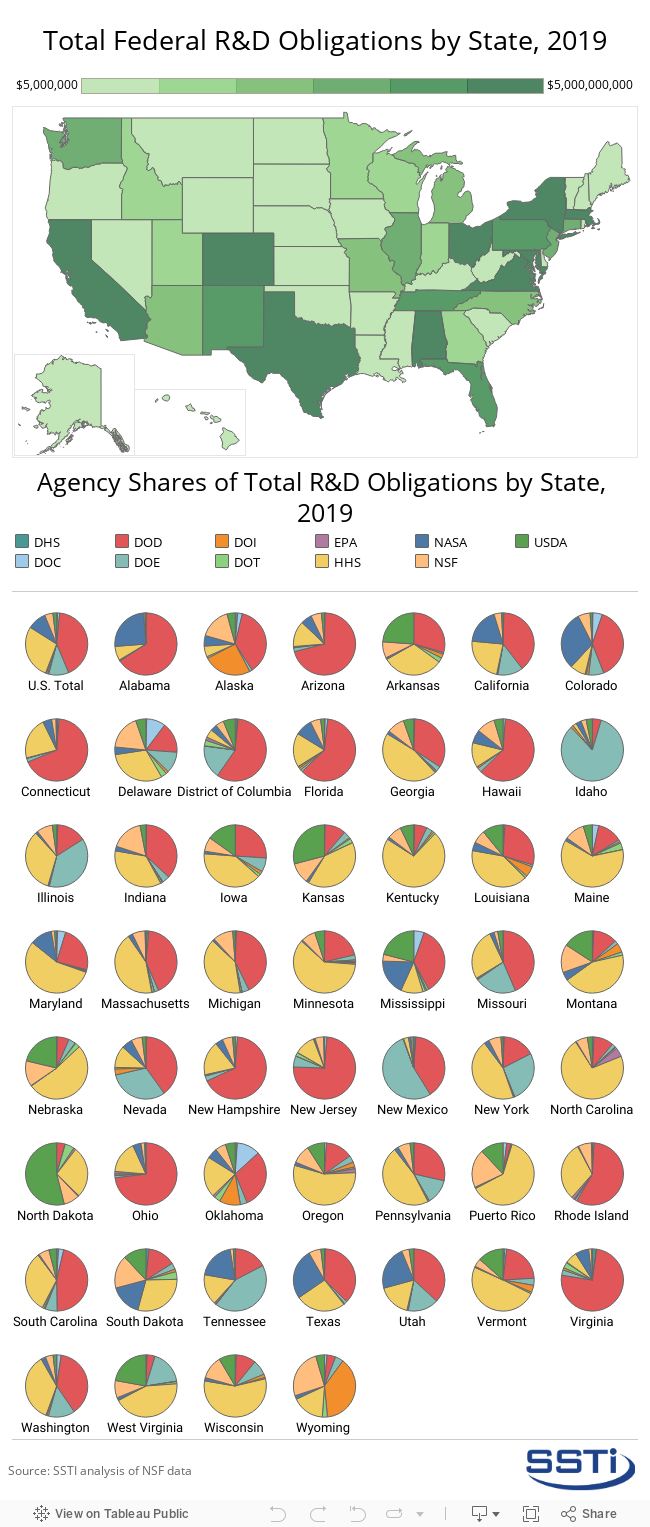
Increasing by $12.4 billion over 2018, federal R&D funding reached $138.2 billion in 2019. However, federal R&D spending in states varied widely as seen in the interactive map below. In 2019, the states that had the greatest levels of federal R&D funding were California ($19.2 billion), Maryland ($16.9 billion), Virginia ($8 billion), Massachusetts ($6.8 billion), and the District of Columbia ($6.2 billion). The states with the least amount of federal R&D funding were Vermont ($120 million), South Dakota ($88.9 million), Puerto Rico ($81.8 million), North Dakota ($73 million), and Wyoming ($67.7 million).
The pie charts below the interactive map show the agency breakdown of the federal R&D funding in each state for 2019. That breakdown is also revealed when hovering the cursor over an individual state in the interactive map. The Department of Defense and the Department of Health and Human Services were the largest federal funders of R&D in most states, while the Department of Energy and, occasionally, the Department of Agriculture accounted for a significant portion of federal R&D funding in some states. To easily compare agency funding levels across states, click on an agency in the color legend of the interactive image below.
Click here to access the data used in this analysis.