Support for small companies has long been a pillar of federal and state policies meant to drive business formation, job creation, and the resulting spillover economic benefits for regional economies. The debate remains, however, about whether smaller or larger businesses play an outsized role in the nation’s economy. This edition of Useful Stats provides some context to the argument, finding that although smaller and newer establishments accounted for the greatest amount of total job creation, job losses from small business closures reduced the group’s net job creation significantly, leaving larger companies to account for the greatest share of net job creation in 2019.
This analysis utilizes the Census Bureau’s updated Business Dynamics Statistics to shed light on job creation by establishment size category at the state level for 2019. Specifically, this analysis examines net job creation and its components — the jobs gained from existing establishments (continuers), jobs gained from new establishments (births), the jobs lost to continuing establishments, and jobs lost to closing establishments (deaths). The size categories used in this analysis are: a) 1 to 9 employees; b) 10 to 19 employees; c) 20 to 99 employees; d) 100 to 499 employees; and e) 500+ employees.
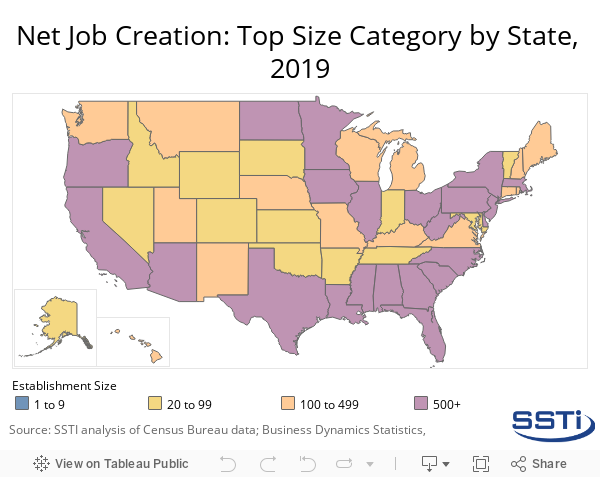
Nationally in 2019, the establishment size group that experienced the greatest net job creation — calculated as the difference between total jobs gained and lost from both continuing establishments and births/deaths — in 2019 was 500+ (790,905 jobs); followed by 100 to 499 (619,422 jobs); 20 to 99 (537,261 jobs); 10 to 19 (150,737 jobs); and 1 to 9 (131,205). It should be noted that these data reflect the conditions of the final year before the onset and global impacts of the Covid-19 pandemic, and will be a benchmark against which future pandemic-inclusive data will be measured.
As seen in the map below, the 500+ size group was the contributor to net job creation in the most states (22 states) in 2019; followed by the 100 to 499 group (15 states); the 20 to 99 group (13 states); and, the 1 to 9 group (only the District of Columbia). The 10 to 19 size group was not the top contributor to net job creation in any states in 2019.
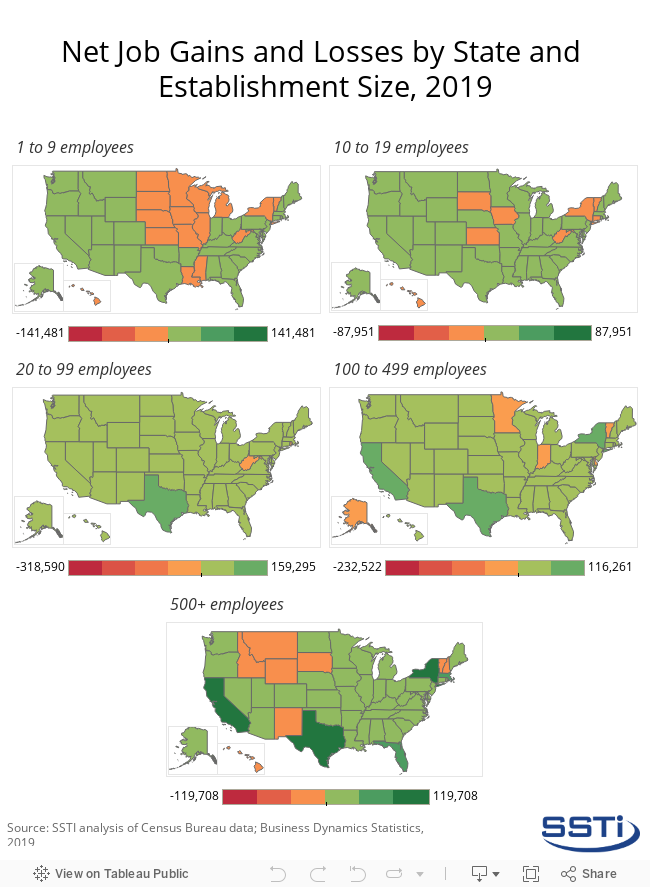
Nationally in 2019, no size group experienced net job losses. However, the image below shows that several states experienced net job losses in one or more size categories in 2019. Specifically, job losses from the 1 to 9 category were particularly concentrated in the Midwest and Great Plains states, losses in the 500+ category were generally concentrated in the northern Rocky Mountain states, while losses in the other size categories were much more disperse in 2019.
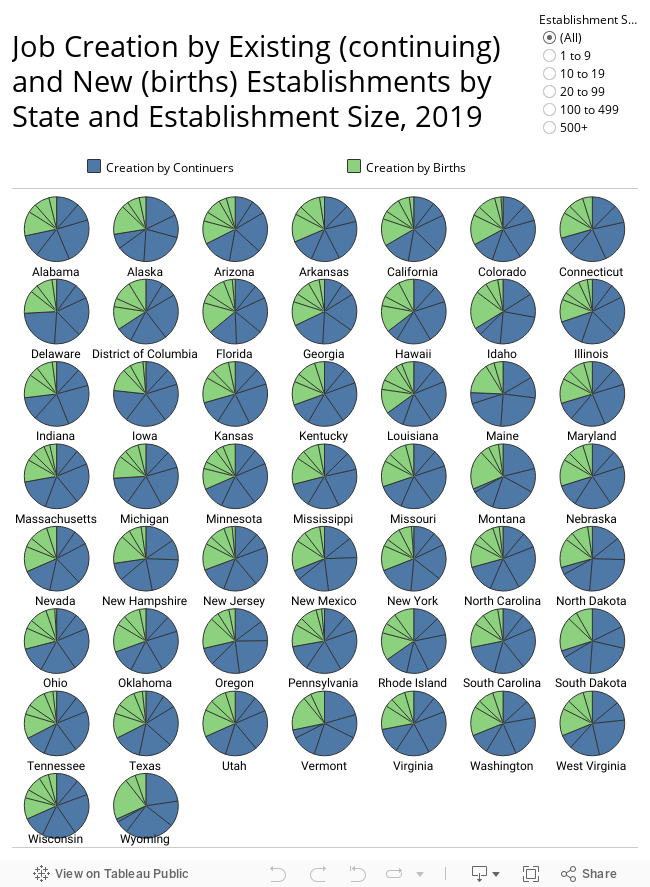
The interactive graphics below provide a deeper look into the dynamics of job creation by establishment size. Net job creation is a calculation of the difference between total job creation and total job destruction. Jobs can be created both by new and existing establishments, and jobs can be lost to existing and closing establishments.
The first interactive graphic below shows the breakdown of job creation by continuing and new establishments by state in 2019. Use the Establishment Size filter on the right of the graphic to explore the data for that size group. The data shows that new establishments account for a larger share of job creation in the smaller size categories across all states in 2019. However, the share of job creation accounted for by continuing establishments increases as size increases.
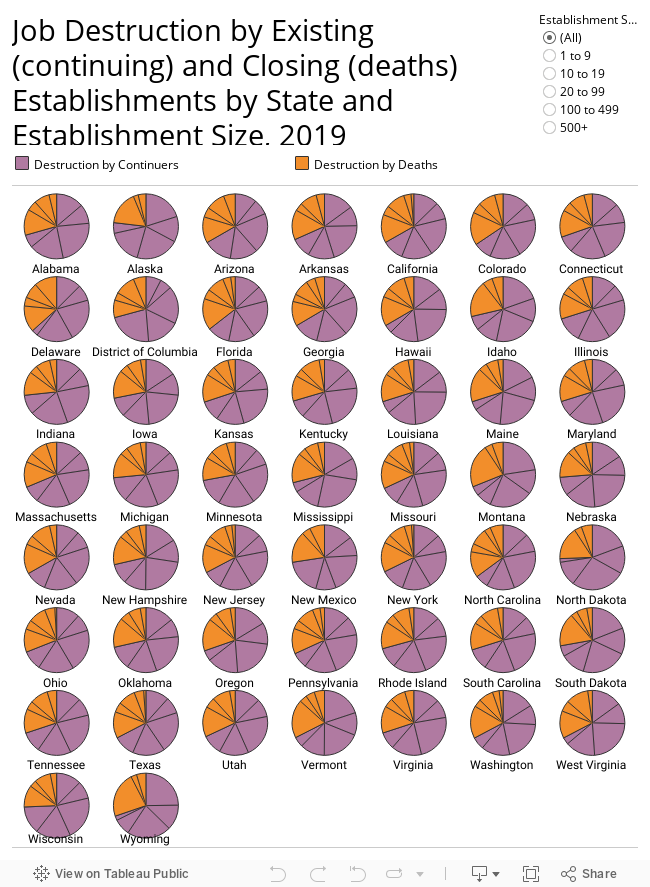
A similar trend is apparent in job losses, as shown in the next interactive graphic below. Job losses at smaller establishments were primarily driven by establishment deaths, rather than by surviving small establishments, in all states in 2019. The share of job losses from surviving establishments increases with establishment size categories.
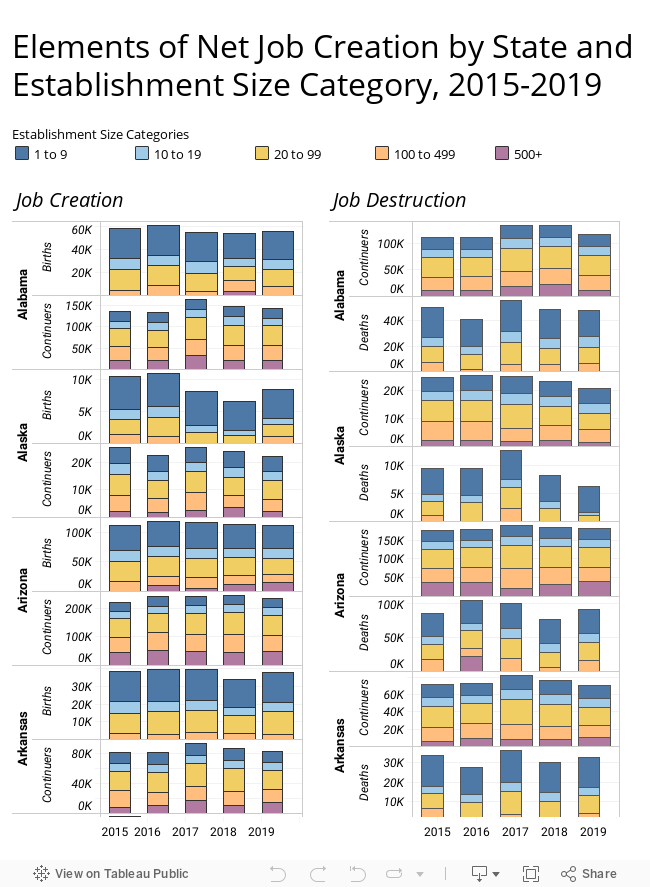
The final interactive graphic below presents these data over the five-year period from 2015 to 2019.
Click here for the data used in this analysis.