

As the most comprehensive resource available for those involved in technology-based economic development, SSTI offers the services that are needed to help build tech-based economies. Learn more about membership...

Useful Stats: Microenterprise R&D performance by state
Stemming from a collaboration between the Census Bureau and the National Center for Science and Engineering Statistics (NCSES) within the National Science Foundation (NSF), a new data set aims to untangle the dynamics of research and development (R&D) performed by private companies. Specifically, the new Annual Business Survey incorporates previously experimental data on the R&D performance by microenterprises — businesses that employ between one and nine people. SSTI’s analysis of this new data shows the total R&D performed by microenterprises in each state, and the portion of that R&D which the companies paid for themselves.
The first interactive map below shows, shaded darkest in blue, that California ($1,884 million); New York ($409 million); and Massachusetts ($384 million) were the top three states for R&D performance by microenterprises in 2017 — the first and most recent year of available data. The top five spots are rounded out with Texas ($329 million) and Florida ($290 million). Other states with large levels of microenterprise R&D include the mid-Atlantic states from New Jersey to North Carolina, as well as Colorado, Oregon, and Washington in the West. Placing the cursor over a state in the map below shows the figure for the total amount of R&D performed by microenterprises in that state.
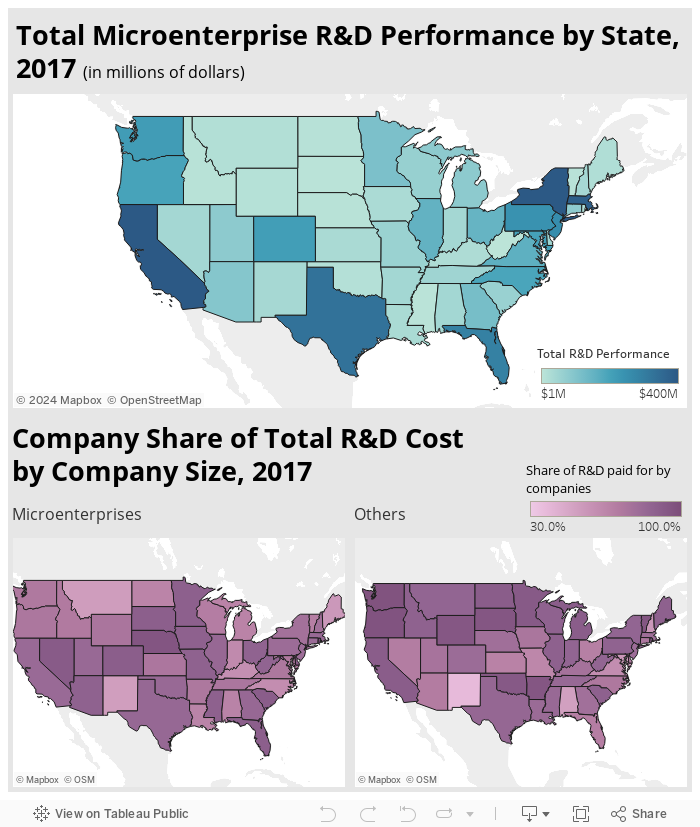
The two purple maps show the share of total business R&D performance in each state that is paid for by the companies performing the R&D. The map on the left shows this figure for microenterprises and the map on the right shows this figure for all other businesses. The states where microenterprises were the most reliant on their own funds for performing R&D were Rhode Island (99.4 percent of total funding), Nebraska (95.4 percent of total funding), and Nevada (92.4 percent of total funding). The map on the left also shows that the states where microenterprises contributed the least to their total R&D performance were New Mexico (52.9 percent of total funding), Montana (52.9 percent of total funding), and Maine (55.4 percent of total funding).
For comparison, the map on the right shows that the states where larger-than-microenterprise businesses contributed the most to their own R&D performance in 2017 were Alaska (99.2 percent of total), Washington (97 percent of total), and Oregon (96.6 percent of total). The states where larger businesses contributed the least to their own R&D were New Mexico (37.2 percent of total), Alabama (51.1 percent), and New Hampshire (55.4 percent). Some states — such as New Mexico, Texas, and others — show consistency between the amount of funding that microenterprises and larger companies contribute to their own R&D efforts. Other states — such as Arkansas, Nevada, and others — show inconsistency between the two groups of companies.
While this new data set provides figures for other business R&D funding sources — such as the federal government, state government, institutions of higher education, and foreign organizations — there is a considerable amount of suppressed and statistically unreliable data publicly available at the state level. For policymakers, the usefulness of the data at this level of geographic detail could be greatly improved by increasing the accuracy and validity of data for the sources of funding for business R&D, and also by providing the industry breakdown of R&D companies at the state level.
Click here to download the Excel workbook used in this analysis.