

As the most comprehensive resource available for those involved in technology-based economic development, SSTI offers the services that are needed to help build tech-based economies. Learn more about membership...

Useful Stats: Performers of federally-funded R&D by state, 2019
Federally funded R&D is a pillar of the U.S. innovation economy, and understanding how that funding is disbursed among the various performers within a state can help regional innovation leaders in developing, designing and implementing investment strategies, programs, and policies. This edition of Useful Stats builds on a previous SSTI analysis of NSF’s recently-updated data on federal R&D funding obligations in 2019, and examines how that funding is distributed within states among industry, universities and colleges, federal agencies, Federally Funded Research and Development Centers (FFRDCs), other nonprofits, and state and local governments.
Nationally in 2019, the majority of the $138.2 billion in federal R&D funds went to industry performers (31.4 percent), followed by federal agencies (27.8 percent), universities and colleges (24 percent), FFRDCs (10.4 percent), other nonprofits (6 percent), and state and local governments (0.4 percent).
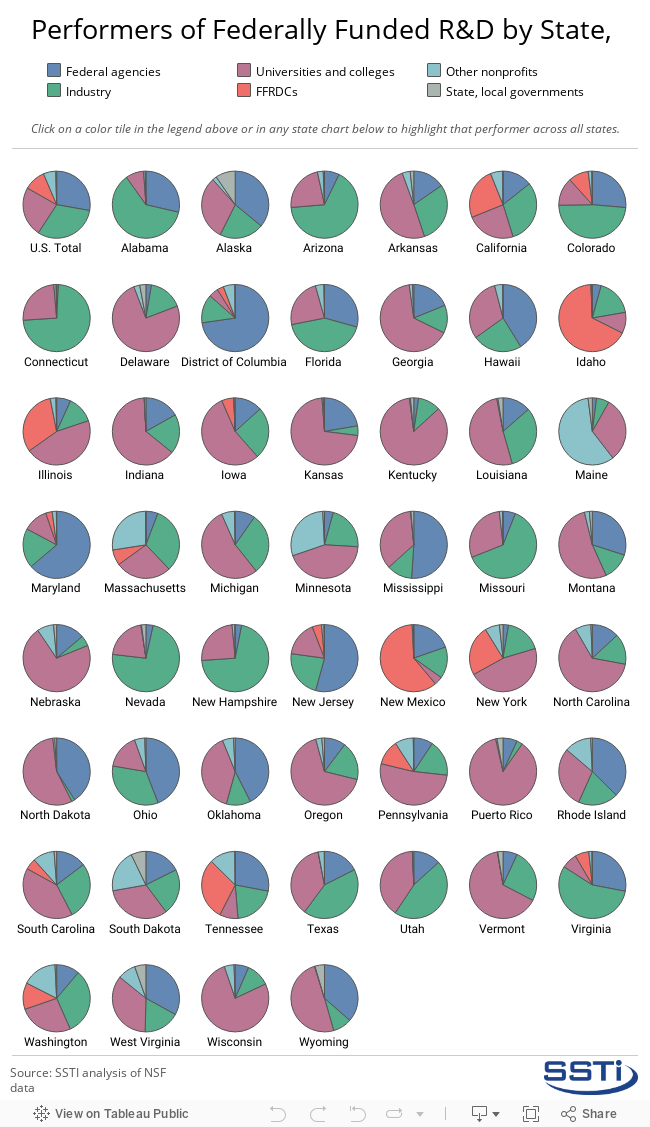
However, the mix of R&D performers within individual states is much more variable as seen in the interactive chart below. On the state level, universities and colleges were the top recipients of federal R&D funding in 25 states, while industry performers were the top recipient in 14 states (AL, AZ, CA, CO, CT, FL, MA, MO, NV, NH, TX, UT, VA, and WA), federal agencies were the top in nine states (AK, DC, HI, MD, MS, NJ, OH, OK, and RI), FFRDCs topped three states (ID, NM, and TN), and other nonprofits were the top recipient of federal R&D funds in only one state (ME).
To highlight these trends in performer shares across all states in the interactive chart below, click on the performer in the legend or on its section in any state chart.
Click here to access the Excel workbook used in this analysis.