An SSTI data analysis finds that in FY 2020, small businesses were less successful in obtaining Small Business Innovation Research (SBIR) and Small Business Technology Transfer (STTR) funding from the Department of Health and Human Services (HHS) — particularly from the National Institutes of Health (NIH) — than they were in FY 2019. NIH provides more funding to the SBIR/STTR program in total than the other participating civilian agency combined, and is also the top funder of the program within most states among the civilian agencies. As such — and with the approaching June 4 deadline for applications to the Federal And State Technology (FAST) Partnership Program — organizations dedicated to supporting technology startups and bolstering local innovation economies should consider how to better assist companies prepare and submit quality SBIR/STTR applications to NIH while designing outreach, education, technical assistance, mentorship, and other entrepreneurial support programs.
In FY 2019 (ended Sept. 30, 2019), applicants nationwide achieved a success rate of 21.8 percent for the NIH SBIR/STTR program, but only achieved a 16.4 percent success rate in FY 2020 (ended Sept. 30, 2020). This development in declining application success rates from FY 2019 to FY 2020 carries across both the SBIR and STTR programs, and at each level of award (Phase I, Fast Track, Phase II, etc.) except for the Direct to Phase II (DP2) award type. As seen in the first chart below, the SBIR program in total and every phase of the program — except DP2 (the highlighted green line) — experienced declines in the application success rate from FY 2019 to FY 2020. As shown in the second chart below, total NIH funding for the SBIR program continued to increase in FY 2020, although this total increase was driven exclusively by DP2 awards, which increased by $83 million from FY 2019 to FY 2020, while every other phase of the program experienced reduced award spending over the same period.
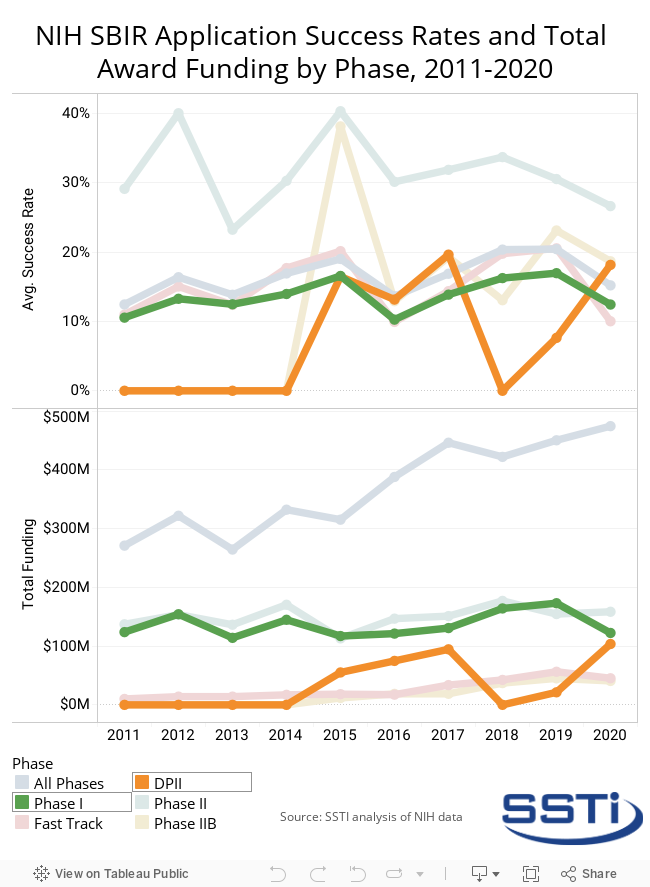
Given that Phase I applications consistently make up the majority of NIH SBIR awards (representing a 62 percent share of all SBIR awards in 2019 and 51 percent in 2020), this analysis primarily considers the success rates of SBIR Phase I applications to NIH, and provides some additional detail on DP2 awards given the starkly different trends in that phase of the program from all others.
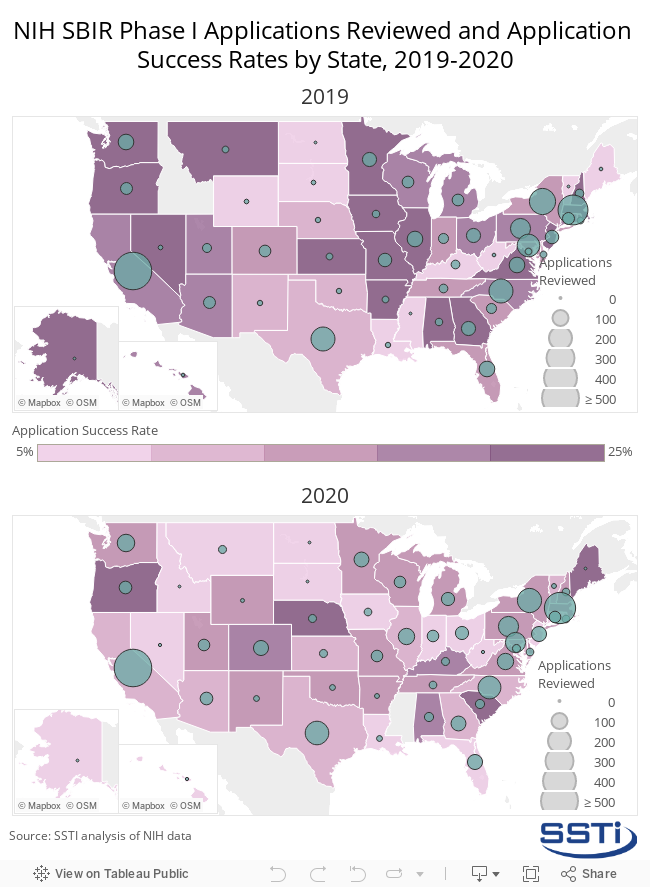
Nationally, NIH SBIR Phase I application success rates dropped from 19.1 percent in FY 2019 to 12.4 percent in FY 2020. As shown in the image below, not every state experienced the same trends in success rates. States with the biggest changes from 2019 were:
- Maine which submitted only one application in 2020 and achieved the highest application success rate in FY 2020 of 100 percent (100 percentage point increase from FY 2019 when Maine submitted zero applications);
- South Carolina with a success rate of 30 percent in FY 2020 (13.3 point increase over FY2019);
- Oregon with a success rate of 24.6 percent (2.9 percentage point decrease over FY 2019);
- Nebraska with a 21.7 percent success rate (12.6 percentage point increase); and,
- Alabama with a success rate of 18.8 percent (21.3 point decrease from FY 2019).
Idaho and North Dakota did not submit any SBIR Phase I applications in FY 2020, while Alaska, Iowa, Montana, Nevada, Puerto Rico, Rhode Island, South Dakota, and West Virginia were unsuccessful in winning any awards.
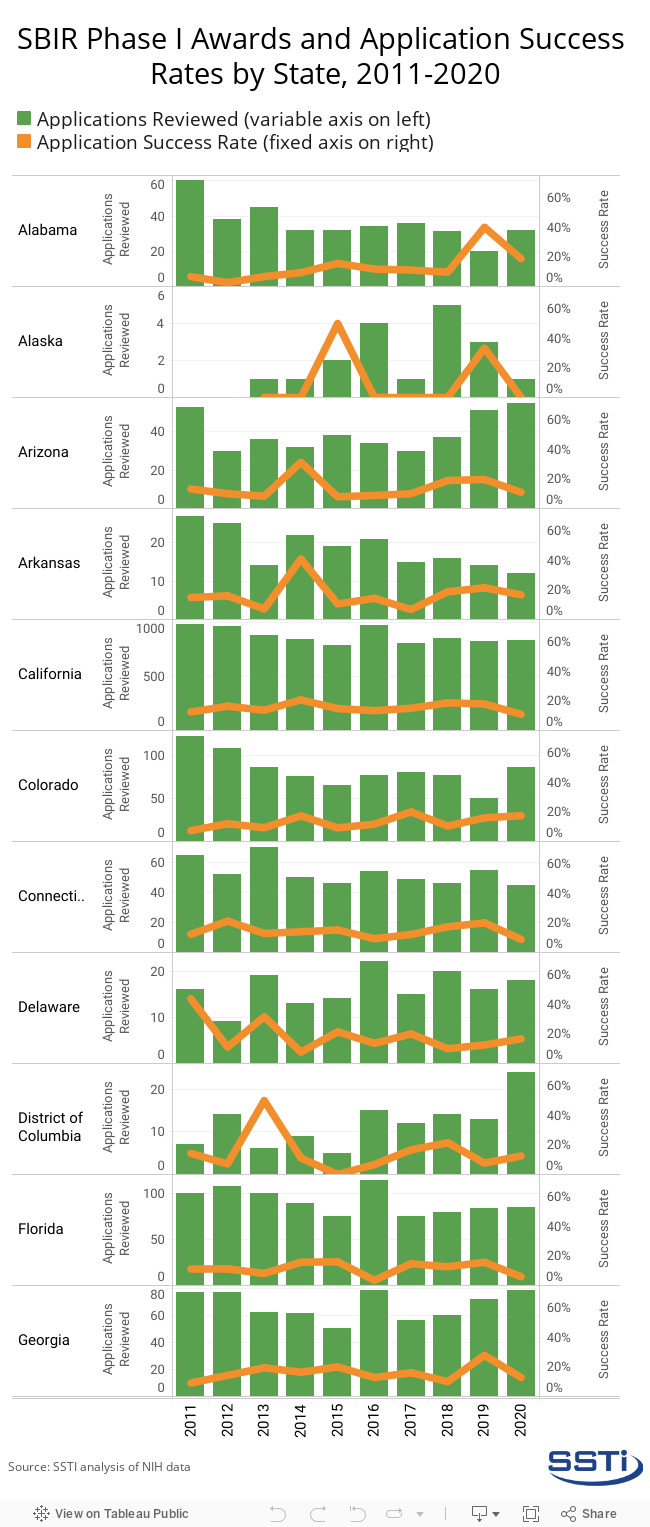
The image below provides another view of each state’s application success rates and includes the number of SBIR Phase I applications reviewed by NIH. The graphs show that these recent drops in application success rates were not simply due to increases in the total number of applications submitted for funding. Some states experienced a negative relationship between these two numbers, with total applications reviewed and success rates moving in opposite directions from each other from FY 2019 to FY 2020. Other states saw a positive relationship, with both figures simultaneously increasing or decreasing over the same period.
This chart also expands the timeframe to start at FY 2011 and end at FY 2020, and — taken together with the national trends presented above — shows that the state trends from FY 2019 to FY 2020 are not exactly typical.
For example, applications reviewed from California remained steady from FY 2019 to FY 2020 while the success rate fell, but when applications rose from FY 2017 to FY 2018 so did the success rate. In this instance, SBIR assistance providers in the state should consider what impacts the pandemic had on their activities since the overall demand for NIH SBIR funding did not drop. States that want to adapt their strategies for supporting innovative companies in winning valuable SBIR funding from the NIH should consider these differences in application submissions and success rate trends and the nuances that surround these figures.
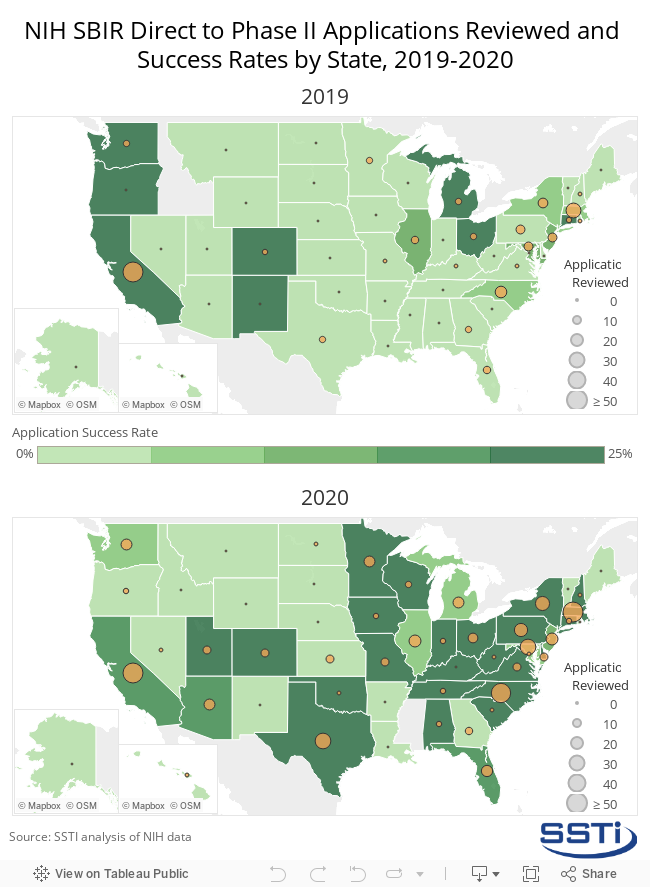
In stark contrast to SBIR Phase I (and all other phases), the DP2 program — a SBIR pilot program currently authorized until FY 2022 to provide Phase II funding to companies that have already accomplished Phase I-type research outside of the SBIR program — saw an increase in both the number of applications reviewed and in the application success rate from FY 2019 to FY 2020. The following image shows that the increasing number of applications reviewed and an increasing application success rate for the NIH SBIR DP2 program carried across most of the nation.
In FY 2019, DP2 applications were submitted from only a handful of states, but success rates were relatively high. In FY 2020, nearly every state increased the number of meritorious DP2 applications submitted to NIH as well as the success rates for those applications. While Phase I continues to represent the bulk of applications, the recent rise in DP2 application success rates and total award funding warrants special attention by those who hope to support startups with more developed technologies in their states.
Click here for the Excel workbook with the data used in this analysis.