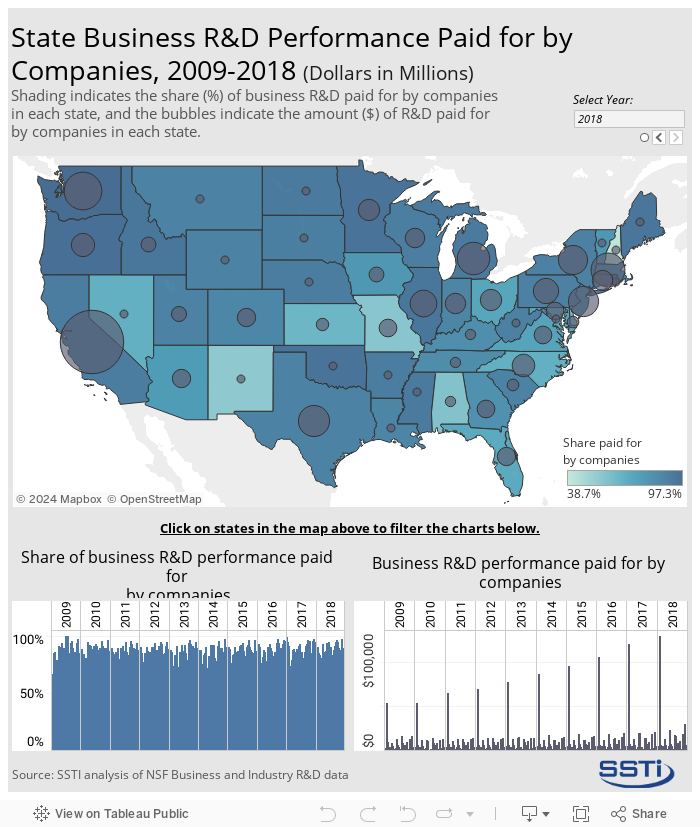
A thriving innovation economy requires a robust R&D enterprise — with participation by academia, government, and the private sector. As a substantial performer and funder of R&D in the United States, the strength of private industry’s R&D activity in a region can provide an indication of the region’s capacity for bringing innovative technologies to market. Using data from the recent release of the National Science Foundation’s 2018 Business Enterprise R&D Survey, this SSTI analysis shows that while total R&D performed domestically by private companies in 2018 increased over 2017, as did the share of the R&D that was paid for by companies, this was not the case for all states.
Total domestic business R&D performance increased in 2018 by $40.1 billion, rising to more than $441 billion. The share of R&D paid for by companies also increased nationally by 0.9 percentage points ($38.8 billion) to 85.7 percent ($377.8 billion) of the total. Companies in California saw the greatest increase in R&D performance ($12.1 billion), followed by Washington ($8.8 billion), New Jersey ($3.8 billion), Massachusetts ($3.6 billion), and Missouri ($1.9 billion). The interactive map below also shows both the share of business R&D performance that was paid for by the companies in each state and the total dollar amount (in millions) that businesses paid for their own R&D for the years 2009 to 2018. Clicking on states in the map will filter the following graphs to show the 10-year trends in these measures.
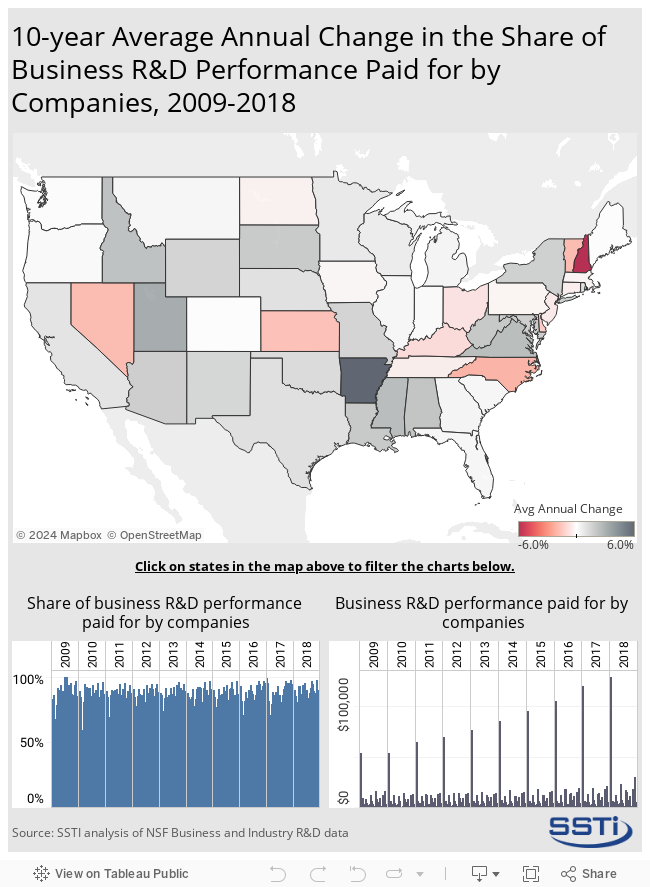
Nationally, the 10-year trends in the total amount and share of business R&D performance paid for by companies also showed increasing activity. From 2009 to 2018, total business R&D increased in the U.S. by 56.2 percent — more than $158.6 billion. As seen in the interactive map below, these 10-year trends vary at the state level. The map shows the average annual percent change in the shares of business R&D paid for by companies was the greatest in Arkansas (6.6 percent), the District of Columbia (4.3 percent), Utah (3 percent), Alaska (2.6 percent), and Mississippi (2.4 percent).
Click here to access the SSTI workbook used for this analysis.