Understanding enrollment trends at the nation’s institutions of higher education — an important indicator of the knowledge capital and skilled workforce available to local innovation economies — is paramount in developing appropriate strategies to bolster local and regional innovation and entrepreneurship. While many institutional reports cover only one or a few years’ worth of enrollment data, evaluating long-run trends can help policymakers and program designers identify issues that might otherwise be hidden, enabling the development of more effective policies and programs.
This edition of Useful Stats builds on last week’s analysis of data for spring term enrollment at degree-granting institutions of higher education from the National Student Clearinghouse Research Center (NSCRC). SSTI compiled data from several NSCRC reports to explore the 10-year trends in spring term enrollment per 1,000 residents by state from 2012 to 2021.
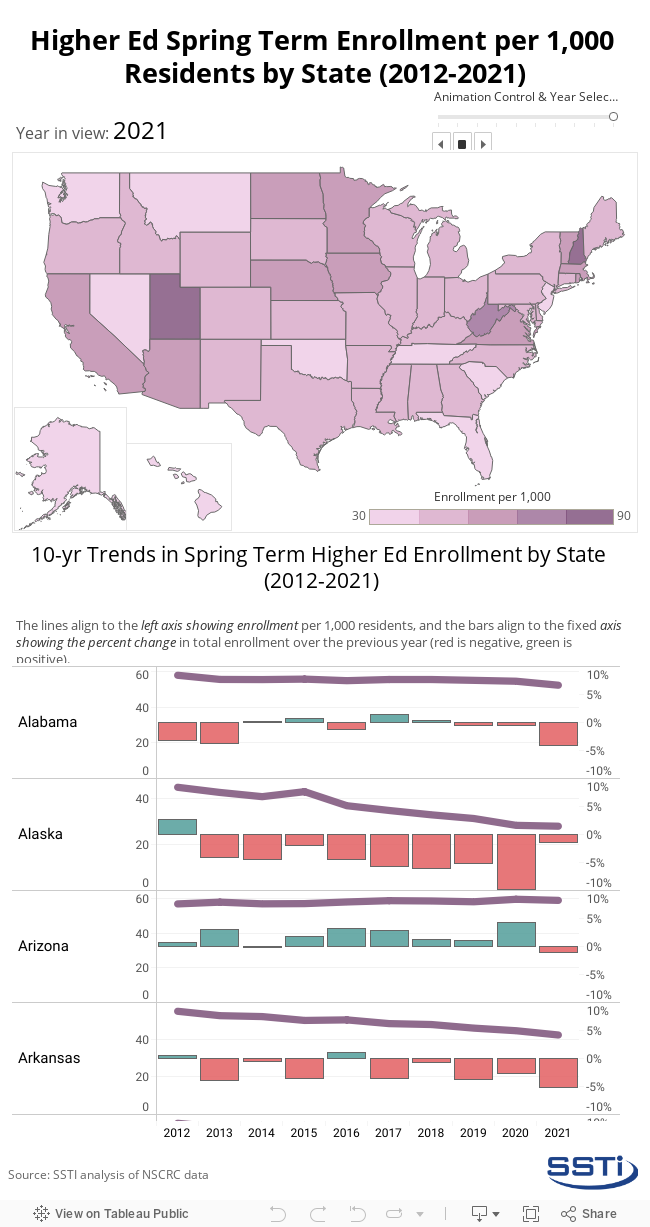
The interactive graphic below shows the annual levels in total higher education spring term enrollment per 1,000 residents by state from 2012 to 2021. The interactive map will continuously loop through the years until the manual controls above the map are used. The graphic depicts the general declines in state enrollment figures across the nation, as well as the few states that experienced enrollment growth over the 10-year period. These trends are explored in more detail in the charts under the map showing the yearly spring enrollment estimates per 1,000 residents in the purple line, and the percent change over the previous spring enrollment estimates with the red (negative) and green (positive) bars.
Although most states experienced declines over the period, several states experienced growth. The states that experienced the greatest percent change in spring term enrollment at degree-granting institutions of higher education over the entire 10-year period from 2012 to 2021 — and the only states to experience enrollment growth over the period — were New Hampshire (147.8 percent); Utah (47.3 percent); Arizona (17.3 percent); Idaho (5.1 percent); Texas (0.8 percent); and Georgia (0.4 percent). Of these states, New Hampshire started the period with relatively low enrollment per 1,000 residents in 2012, quickly increased those numbers in 2013, and since then has increased spring term enrollment each year by double digits except for 2018 (1 percent increase over 2017) and 2020 (3 percent increase over 2019). Utah and West Virginia also stand out as having been particularly resistant to declines in enrollment, maintaining top positions in the number of enrolled students per 1,000 residents over the whole period.
The states that experienced the greatest declines in spring term enrollment over the same period were Missouri (-27.2 percent); Michigan (-29.9 percent); New Mexico (-34.4 percent); Alaska (-37.7 percent); and Iowa (-45.6 percent). Each of these states, except Iowa, experienced relatively consistent declines over the period. Iowa experienced the greatest declines in enrollment per 1,000 residents from 2012 — when it had the greatest enrollment per 1,000 residents in the country — to 2016, representing a drop from 102 to 62 enrolled students at institutions of higher education per 1,000 residents in the state. Since 2016, enrollment continued to decline in the state, but at a much slower pace than in the first part of the decade.
Click here for the SSTI spreadsheet containing the compiled NSCRC data used in this analysis.