Private sector investment into research and development (R&D) is a critical component of innovation, new product development, and regional economic vitality. As a substantial performer and funder of R&D in the United States, the strength of private industry’s R&D activity in a region can provide an indication of the region’s capacity for developing and bringing innovative technologies to market. Using data from the recent release of the National Science Foundation’s 2019 Business Enterprise R&D (BERD) Survey, this SSTI analysis shows that while private companies nationally paid for the greatest share of total business R&D expenditures themselves in 2019, this was not the case for all states.
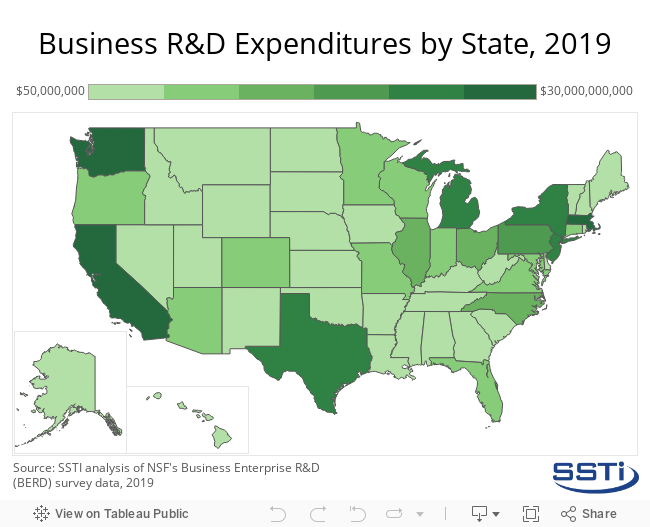
Nationally, companies spent nearly $493 billion on R&D in 2019 — representing an increase of 11.8 percent over the previous year. As seen in the interactive map below, the states with the greatest levels of total R&D spending by businesses in 2019 were California ($192 billion); Washington ($37 billion); Massachusetts ($31 billion); Texas ($24 billion); and, Michigan ($21 billion). The states with the lowest levels of total R&D business expenditures in 2019 were Vermont ($244 million); Montana ($205 million); South Dakota ($194 million); Hawaii ($159 million); and, Alaska ($49 million).
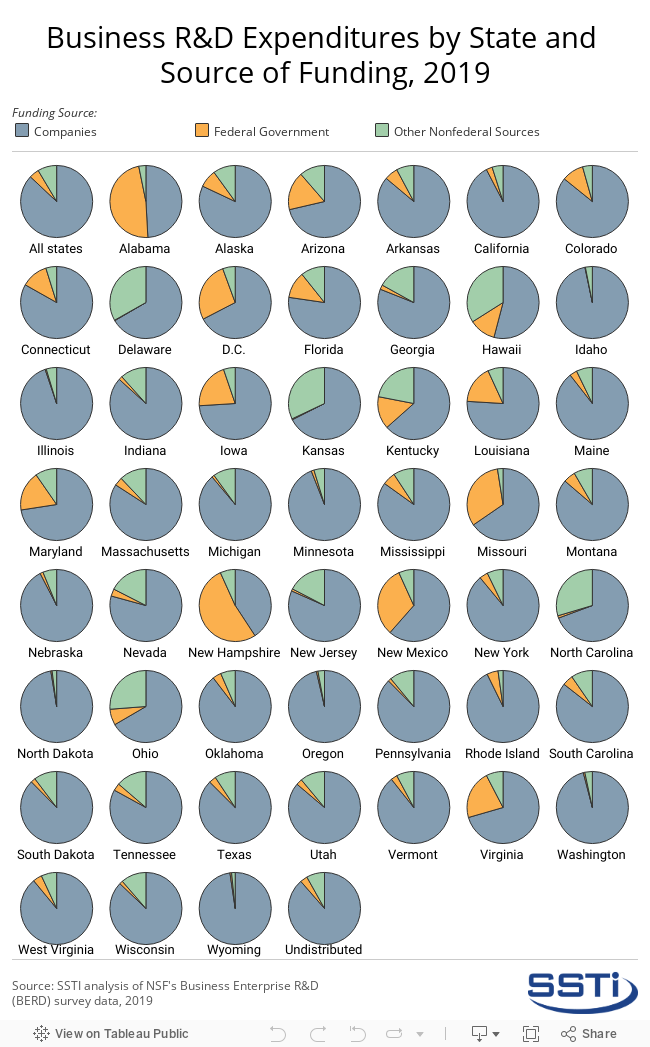
Companies paid for 87 percent ($429 billion) of business R&D expenditure is 2019 using their own funds, while other sources accounted for the remaining 13 percent ($64 billion). The majority of business R&D funding in 2019 came from companies in most states. The states that experienced the greatest shares of business R&D funding from companies in 2019 were Wyoming (97.7 percent, $670 million); North Dakota (97.4 percent, $340 million); Idaho (96.7 percent, $2.6 billion); Oregon (96.4 percent, $7.6 billion); and Washington (96 percent, $35.8 billion). The states that had the lowest shares of business R&D funding coming from companies in 2019 were Kentucky (63.4 percent, $939 million); New Mexico (61.4 percent, $391 million); Hawaii (54.1 percent, $86 million); Alabama (49.2 percent, $1.2 billion); and, New Hampshire (40.8 percent, $1 billion).
A thriving innovation economy requires a robust R&D enterprise — with participation by the private sector, government, and academia and other nonprofits. While this analysis is focused on the R&D expenditures of private businesses, organizations other than the businesses themselves often bolster the R&D funding available to companies. The interactive graphic below shows the breakdown of total business R&D funding sources, including 1) companies; 2) the federal government, and 3) other nonfederal sources.
As seen below, the federal government was the greatest source of business R&D funding in New Hampshire (52.5 percent) in 2019 — with Alabama (47.7 percent), Missouri (32.1 percent), and New Mexico (31.7 percent) also experiencing relatively large proportions of funding from federal sources. While other nonfederal sources did not account for the greatest share of funding in any state in 2019, the states with the greatest shares of business R&D funding from other nonfederal sources were Hawaii (34 percent; $54 million); Delaware (33.2 percent; $715 million); Kansas (32 percent, $880 million); North Carolina (29.6 percent, $3.9 billion); and, Ohio (26.2 percent, $2.8 billion).
Click here for the data used in this analysis.