Although changes in gross domestic product (GDP) give us an idea of how economies are changing, this measure fails to tell the full story. This edition of Useful Stats examines county-level GDP-per-capita, the measure of economic output for each resident in an area. What we see is strongly skewed data with high 2018 GDP-per-capita levels and high 10-year growth rates concentrated primarily in low population-high output counties. We also see that rural populations have declined over the period while metropolitan areas have grown, yet the median GDP-per-capita growth rates between the groups are essentially the same.
Previous analysis by SSTI shows that total county GDP in 2018 was highly concentrated in California, coastal New England, and Florida, with other pockets of economic strength scattered throughout the country. However, as shown in the interactive map below, GDP-per-capita is primarily concentrated in western Texas up to the upper Plains and extending into the eastern Rocky Mountain Range. Southern California and portions of New England still show relatively high levels of per-capita county GDP. The southeastern quarter of the country — from eastern Oklahoma and Missouri through the Deep South and up through Appalachia — shows relatively uniform low levels of per-capita county GDP, save several scattered counties that are home to larger metropolitan areas such as Nashville in Davidson County, Tennessee and Little Rock in Pulaski County, Arkansas.
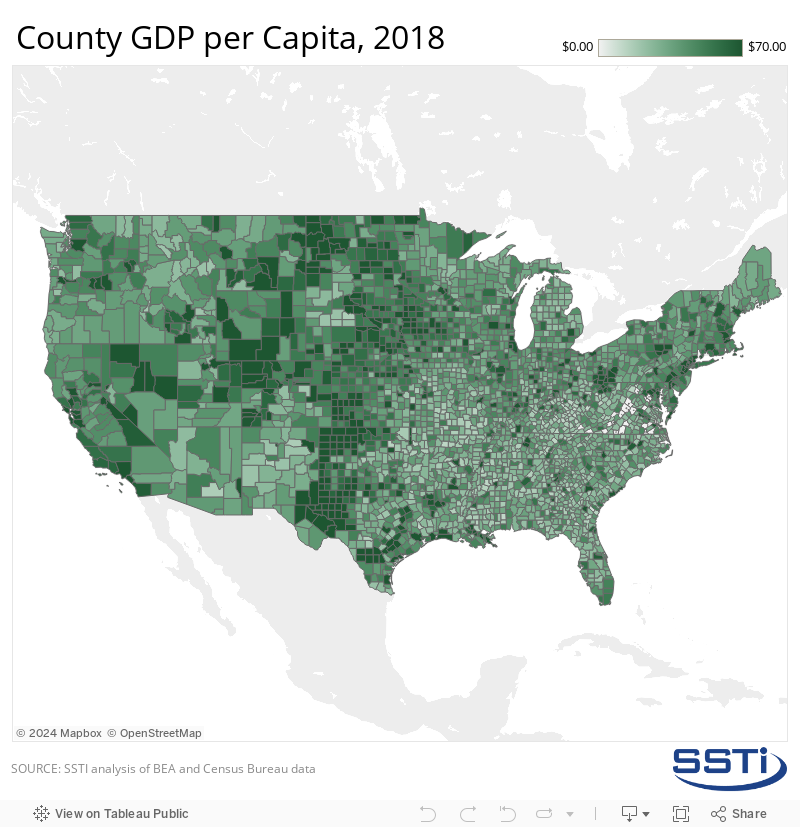
Nine of the ten counties with the highest GDP-per-capita in 2018 were in Texas and ranged from $1,051 per person in La Salle to more than $93,000 per person in Loving. As shown in previous analyses from SSTI, this region has experienced exponential growth in the mining industry. Coupled with very low populations, these counties are anomalies where the per capita GDP calculations can be more easily skewed. With the average county GDP-per-capita in 2018 ($84) being nearly 55 percent higher than the median ($38) and 171 counties statistically considered outliers, these regions with exceptionally high GDP skew the data drastically towards the high end.
The metropolitan counties — being home to either entire or partial metro areas — with the greatest GDP-per-capita in 2018 were Martin, Texas ($1,745); Irion, Texas ($1,127); Storey, Nevada ($377); Butte, Idaho ($369); New York ($368); Cameron, Louisiana ($278); San Francisco ($187); St. Charles, Louisiana ($183); Washington D.C. ($181); and Oldham, Texas ($173).
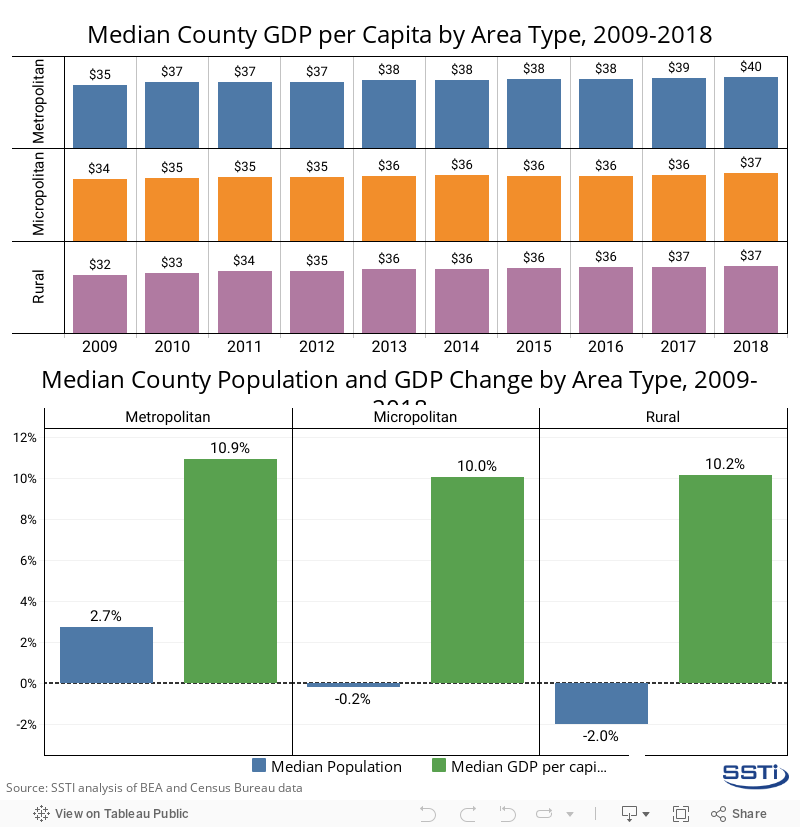
As shown in the first chart below, the median GDP-per-capita in metropolitan areas has been consistently higher — although only slightly — than in micropolitan and rural areas since 2009. The second chart shows that while the trends in population change have diverged — with metropolitan counties growing and populations in rural counties shrinking — the GDP-per-capita growth rates between area types are roughly the same at 10-11 percent.
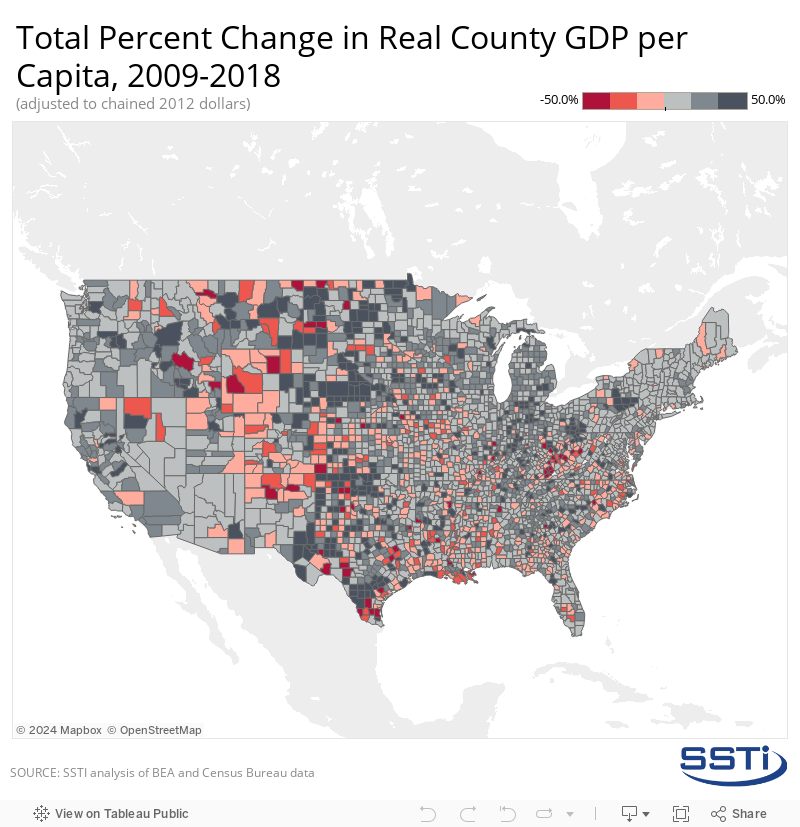
The map below provides greater detail into the geographic distribution of county GDP-per-capita rates. We can see that the steepest increases in county GDP-per-capita over the 10-year period from 2009 to 2018 were driven primarily by regional surges in the mining industry. While the Deep South and Appalachia experienced scattered cases of extreme GDP-per-capita losses, the most drastic decreases are more concentrated in the Mountain West and directly surrounding the areas that have seen the greatest growth in GDP-per-capita over the same period. The counties that experienced a decrease in GDP-per-capita over the 10-year period are indicated by red shading and range from an 83 percent decrease in St. John the Baptist Parish in Louisiana to less than 1 percent in counties in Mississippi, Ohio and West Virginia.
An excel file with the data can be accessed here.