Federal obligations for science and engineering research and development to universities, colleges, and nonprofit institutions increased by 5.7 percent from FY 2013 to FY 2014, according to recently released data from the National Science Foundation’s (NSF) Survey of Federal Funds for Research and Development. For the fourth consecutive year, the states with the largest federal obligations for science and engineering R&D to universities, colleges and nonprofit institutions in FY 2014 were California ($3.9 billion), New York ($2.2 billion), and Maryland ($1.8 billion). Between FY 2013 and FY 2014, 38 states and the District of Columbia saw an increase in federal obligations for science and engineering research and development at these organizations. An Excel sheet that shows the obligations for each state from FY 2006 to FY 2014, plus comparisons between three specific time periods can be found here.
In FY 2014, 61.3 percent of federal R&D obligations for science and engineering R&D went to the top 10 states (California; New York; Maryland; Pennsylvania; Massachusetts; Texas; North Carolina; Michigan; Illinois; and, Georgia). Of the approximately $1.5 billion in increased obligations for science and engineering R&D at universities and other research institutes from FY 2013 to FY 2014, 71 percent went to these same 10 states. The share of total R&D dollars for university and college S&E flowing to the top 10 states has increased every year from FY 2011 to FY 2014, though only by a marginal amount (0.5 percentage points per year, on average).
The states seeing the largest percentage increase from FY 2013 to FY 2014 in federal obligations for science and engineering research and development at universities and colleges were South Dakota (53.5 percent increase), Michigan (32 percent), and South Carolina (20.8 percent). Michigan received an additional $273.1 million between FY 2013 and FY 2014, an increase that is nearly $115 million more than any other state received; the increase is due in large part to obligations increasing $284 million from FY 2013 to FY 2014 to the University of Michigan. Maine (-24.7 percent), Idaho (-14.4 percent), and Louisiana (-8.9 percent) had the largest percentage decreases of the 12 states that had lower obligation levels in FY 2014 than in FY 2013.
Because of the irregular influx in federal spending in research and development during FY 2009 and FY 2010 as a result of the the American Recovery and Reinvestment Act of 2009 (ARRA), SSTI examined the three-year change from FY 2011 to FY 2014, which looks at shifts after the ARRA, as well as the six-year change from FY 2008 to FY 2014, which benchmarks obligations before the onset of the Great Recession.
Federal obligations for university and college-based science and engineering R&D increased by approximately 7.5 percent from FY 2008 to FY 2014. Michigan (43.3 percent), Maryland (24.8 percent), and Georgia (19.6 percent) saw the largest percentage increase in obligations FY 2008 and FY 2014, while North Dakota ( -36.7 percent), Mississippi (-34.7 percent), and Arkansas (-31.3 percent) have seen the largest decrease in obligations over the same time period. Compared to their FY 2008 obligation levels, 19 states saw a decrease in FY 2014.
Just 15 states and the District of Columbia received more federal obligations for science and engineering R&D at universities in FY 2014 than in FY 2011, the first year after ARRA. South Carolina (23.7 percent increase), Nevada (22.8 percent), and New Mexico (19.4 percent) saw the largest percentage increases in federal obligations for university and college science and engineering R&D between FY 2011 and FY 2014. Arkansas (-35 percent), North Dakota (-28.4 percent), and Montana (-24 percent) have seen the largest percentage decreases over the same time period.
Additionally, SSTI looked at how research and development for science and engineering at universities and colleges changed at a larger, regional level. To categorize states, SSTI used the six regions defined by the U.S. Economic Development Administration (note: EDA does not use these region names, but rather refers to the regions by the regional office names). The six regions are:
● Central (7.6 percent of total obligations for university and college-based science and engineering R&D in FY 2014): Colorado, Iowa, Kansas, Missouri, Montana, North Dakota, Nebraska, South Dakota, Utah, and Wyoming;
● Great Lakes (15.4 percent of total obligations in FY 2014): Illinois, Indiana, Michigan, Minnesota, Ohio, and Wisconsin;
● Northeast (35 percent of total obligations in FY 2014): Connecticut, Delaware, District of Columbia, Maine, Maryland, Massachusetts, New Hampshire, New Jersey, New York, Pennsylvania, Rhode Island, Vermont, Virginia, and West Virginia;
● Southeast (14.1 percent of total obligations in FY 2014): Alabama, Florida, Georgia, Kentucky, Mississippi, North Carolina, South Carolina, and Tennessee;
● South Central (6.8 percent of total obligations in FY 2014): Arkansas, Louisiana, New Mexico, Oklahoma, and Texas; and,
● West (20.8 percent of total obligations in FY 2014): Alaska, Arizona, California, Hawaii, Idaho, Nevada, Oregon, and Washington.
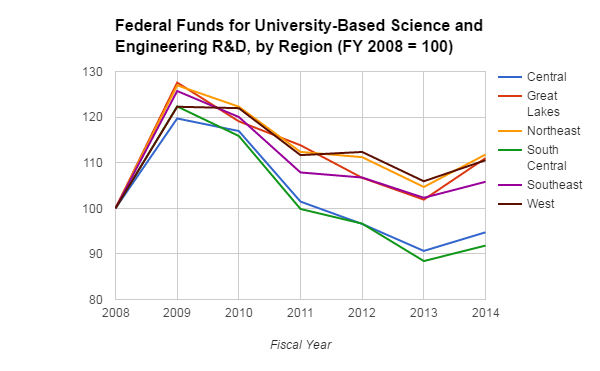
The chart below highlights how federal obligations for each of these regions changed from FY 2008 to FY 2014. Although each region received increased funds in in FY 2009 as part of ARRA, their funding levels since then have been considerably different. In particular, the Central and South Central regions have considerably lower obligation levels than their FY 2008 levels. The Northeast, Great Lakes, and West regions all had more federal obligations for university and college-based science and engineering R&D in FY 2014 than in FY 2008.
For additional insight, readers can download the data at http://ssti.org/sites/default/files/Useful%20Stats-%20S%26E%20R%26D%20to%20Universities%20and%20Colleges%2C%20by%20State.xlsx , or from the NSF’s website at: https://ncsesdata.nsf.gov/fedsupport/2014/.
| Federal obligations for science and engineering research and development to universities and colleges, by state and outlying area: FYs 2006-14 | |||
|---|---|---|---|
| State | % Change, FY08 to FY14 (Pre-Recession) | % Change, FY11 to FY14 (Post-ARRA) | % Change, FY13 to FY14 |
| All States | 7.47% | -2.19% | 5.72% |
| Alabama | 4.69% | -1.65% | 6.77% |
| Alaska | -1.19% | -13.82% | 8.24% |
| Arizona | 0.39% | -12.43% | -8.48% |
| Arkansas | -31.28% | -34.93% | -6.23% |
| California | 10.57% | -0.55% | 4.22% |
| Colorado | -2.42% | -5.11% | -3.01% |
| Connecticut | 0.20% | -6.31% | 4.03% |
| Delaware | 11.19% | 2.27% | 14.06% |
| District of Columbia | 14.64% | 8.08% | 1.85% |
| Florida | 1.34% | -5.59% | 4.76% |
| Georgia | 19.56% | 1.33% | -2.58% |
| Hawaii | 6.72% | -1.63% | 4.35% |
| Idaho | -16.64% | -14.56% | -14.42% |
| Illinois | 5.87% | -5.67% | 3.58% |
| Indiana | 13.40% | -0.84% | 13.27% |
| Iowa | -14.38% | -15.84% | -0.53% |
| Kansas | -4.63% | -13.64% | 6.34% |
| Kentucky | -1.58% | -6.11% | 11.76% |
| Louisiana | -15.69% | -23.94% | -8.85% |
| Maine | -10.35% | -5.53% | -24.72% |
| Maryland | 24.82% | -0.18% | 8.66% |
| Massachusetts | 4.13% | -0.69% | 6.47% |
| Michigan | 43.34% | 16.25% | 32.00% |
| Minnesota | 7.93% | -22.13% | 1.20% |
| Mississippi | -34.67% | -13.06% | -3.33% |
| Missouri | -8.31% | -3.13% | 11.07% |
| Montana | -10.88% | -24.03% | -2.87% |
| Nebraska | -1.88% | 3.25% | 8.78% |
| Nevada | 11.63% | 22.79% | 15.04% |
| New Hampshire | 17.07% | 11.43% | 1.22% |
| New Jersey | 3.98% | -4.00% | 14.89% |
| New Mexico | 15.30% | 19.38% | 8.13% |
| New York | 11.82% | 2.19% | 5.72% |
| North Carolina | 10.04% | 1.36% | 4.43% |
| North Dakota | -36.89% | -28.43% | 4.04% |
| Ohio | -9.41% | -9.44% | -4.65% |
| Oklahoma | 13.41% | -5.90% | 8.29% |
| Oregon | 13.12% | 1.13% | 9.31% |
| Pennsylvania | 15.01% | -2.27% | 7.45% |
| Rhode Island | 4.23% | 2.11% | 5.16% |
| South Carolina | 0.08% | 23.70% | 20.77% |
| South Dakota | -21.29% | -4.99% | 53.45% |
| Tennessee | 3.16% | -12.54% | -0.49% |
| Texas | -10.04% | -7.46% | 4.96% |
| Utah | 18.91% | 3.72% | 8.76% |
| Vermont | -2.21% | -2.69% | 6.38% |
| Virginia | 11.67% | -4.89% | 5.71% |
| Washington | 18.34% | 2.16% | 9.54% |
| West Virginia | -23.43% | -10.24% | 17.88% |
| Wisconsin | 2.22% | -3.01% | 3.04% |
| Wyoming | 8.07% | 6.44% | 0.74% |