

As the most comprehensive resource available for those involved in technology-based economic development, SSTI offers the services that are needed to help build tech-based economies. Learn more about membership...

Useful Stats: Higher Ed R&D intensity by metro, 2019
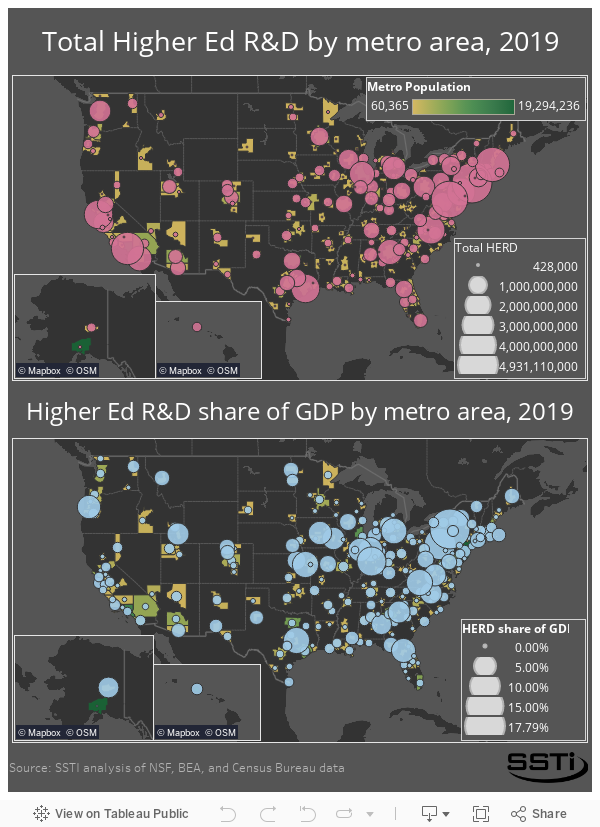
Metropolitan areas in the U.S. with fewer than 370,000 residents are more likely to be more economically reliant on R&D performed by colleges and universities than larger metros, according to new SSTI analysis. Three data points are used to consider how R&D at institutions of higher education is impacting a region’s economy: NSF’s Higher Education R&D (HERD) data on expenditures at individual institutions; metro area Gross Domestic Product (GDP) data from the Bureau of Economic Analysis; and population estimates from the Census Bureau. The resulting analysis shows that despite larger metro areas producing a greater total amount of HERD, they are typically less reliant on these expenditures directly powering their economies.
As seen in the first map below, the five metropolitan areas that experienced the greatest total HERD expenditures in 2019 were the New York-Newark-Jersey City NY-NJ-PA metro ($4.9 billion); followed by* Boston-Cambridge-Newton MA-NH ($3.6 billion); Los Angeles-Long Beach-Anaheim CA ($3.2 billion); San Francisco-Oakland-Hayward CA ($2.5 billion); and Houston-The Woodlands-Sugar Land TX ($2.5 billion). Each of these metro areas has a large population.
Grouping metro areas into quintiles (the first quintile containing the metro areas with populations ranging between 60,365 and 205,369 and the fifth quintile containing the metros with populations in excess of 1.3 million) and presenting HERD expenditures as a share of metro area GDP (metro area HERD intensity), we can see in the second map below that the metro areas with greater populations often show lower levels of HERD intensity compared to smaller metros. The metro with the greatest HERD intensity in 2019 was Ithaca, New York (17.8 percent, quintile 1); followed by State College, Pennsylvania (10.3 percent, quintile 1); Bloomington, Indiana (8.7 percent, quintile 1); Blacksburg-Christiansburg-Radford, Virginia (6.9 percent, quintile 1); Lawrence, Kansas (6.8 percent, quintile 1); and College Station-Bryan, Texas (6.8 percent, quintile 2).
Metro areas garnered more than 90 percent of all R&D expenditures at colleges and universities in 2019 in all but seven states — Oklahoma (only 65.5 percent in metro areas), Montana (38.3 percent), Idaho (32.6 percent), New Hampshire (30.3 percent), Mississippi (18.3 percent), South Dakota (11.7 percent), and Wyoming (none).
Of the 225 metro areas included in this analysis, 43 experienced HERD intensity greater than 1 percent and only 12 metros experienced HERD intensity greater than 5 percent. After the six top metros listed above the remaining six of these 12 metros with more than 5 percent HERD intensity are: Ann Arbor, Michigan (6.6 percent); Gainesville, Florida (5.7 percent); Lafayette, Indiana (5.6 percent); Champaign-Urbana, Illinois (5.5 percent); Ames, Iowa (5.3 percent); and Corvallis, Oregon (5.3 percent).
Click here for the SSTI spreadsheet used in this analysis.
*The Baltimore-Columbia-Towson MD metro area experienced $4.1 billion in total HERD spending according this analysis — the second most of any metro area. However, the University System of Maryland recently started collectively reporting the R&D performed by each of the universities associated with the System under one university located in Baltimore, thereby skewing the results away from the nearby Washington-Arlington-Alexandria DC-VA-MD-WV metro area.