Given higher education’s role in generating the knowledge that catalyzes innovative new technologies developed by high-growth startups, R&D conducted at institutions of higher education is one of the most important metrics for evaluating an area’s innovation economy. This edition of Useful Stats examines NSF’s recently updated Higher Education R&D (HERD) survey, finding that most states, although not all, experienced growth in HERD expenditures from 2018 to 2019. This analysis also examines 2019 state HERD expenditures by R&D field, finding that life sciences accounted for the lion’s share of HERD spending in every state except Alaska, typically followed by either engineering; the physical sciences; or the geological, atmospheric, and ocean sciences.
The states with the greatest levels of total HERD expenditures in 2019 were California ($10.5 billion), New York ($7.1 billion), Texas ($6 billion), Pennsylvania ($4.7 billion), and Maryland ($4.6 billion). However, as seen in the interactive map below shaded in the darkest green, the states that experienced the greatest growth in total HERD expenditures from 2018 to 2019 were Montana (18.8 percent), Maine (17.7 percent), Puerto Rico (17.5 percent), and Utah (13.8 percent), and Mississippi (11.8 percent).
While most states experienced moderate growth in HERD expenditures, several states experienced declines, as seen shaded orange or red in the map below. The states that experienced a drop in annual HERD expenditures from 2018 to 2019 were Wyoming (-28.9 percent), Idaho (-1.8 percent), New Jersey (-1.4 percent), New Mexico (-0.9 percent), and Iowa (-0.6 percent).
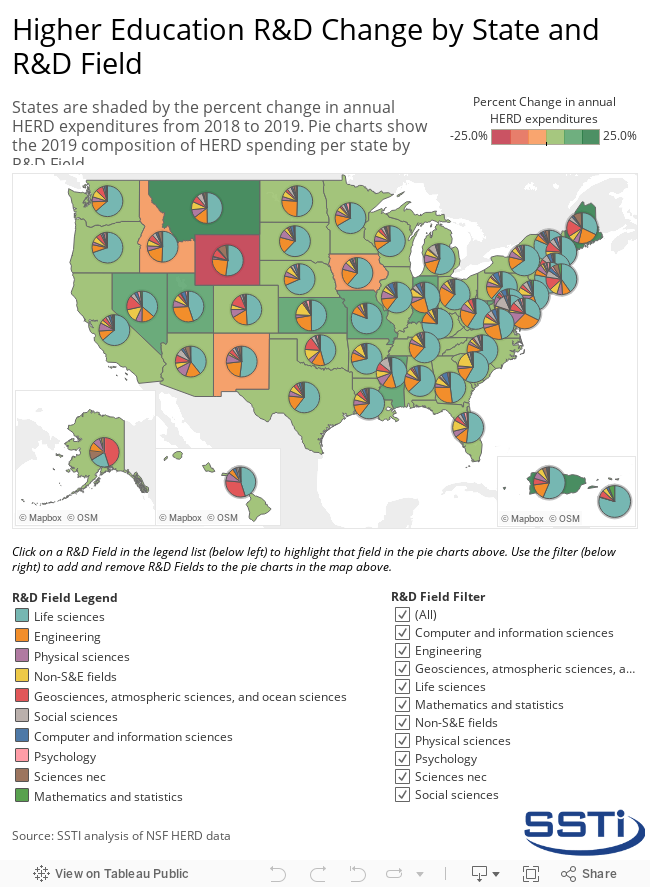
The pie charts in the interactive map above show the shares of HERD expenditures for each R&D field per state in 2019. The life sciences field received the most funding in every state except Alaska (where the top field was the geological, atmospheric, and ocean sciences) and accounted for $48.2 billion in total U.S. HERD expenditures. Engineering was typically the second most funded R&D field in each state (accounting for $13.2 billion in total U.S. HERD expenditures), although the physical sciences ($5.6 billion in U.S. total); and the geological, atmospheric, and ocean sciences fields ($3.2 billion in U.S. total) were the second most funded R&D fields in several states.
The interactive map can be used to more closely explore the composition of HERD spending by field in each state by clicking on a R&D Field in the legend list (below and left of the map) to highlight that field in the pie charts in the map above. Use the R&D Field filter (below and to the right of the map) to add and remove R&D Fields to the pie charts in the map.
Click here to access the SSTI Excel file used in this analysis.