An important element of a region’s innovation community is its knowledge capital, and one way to try to determine a locality’s knowledge capital is to examine the number of individuals receiving research-based doctorate degrees in the science and engineering (S&E) fields. The National Science Foundation (NSF) recently updated their Survey of Earned Doctorates with data for the 2018-2019 academic year. For the period ranging from July 1, 2018 to June 30, 2019, the number of total PhDs awarded increased nationally by 1.1 percent over the previous academic year to 55,703. The update also shows that the number of degrees awarded to recipients in S&E fields was 42,980. SSTI’s analysis explores the total number of S&E PhDs awarded per state, as well as the number of S&E PhDs per 100,000 state population.
As seen in the first interactive map below, the states that awarded the greatest number of S&E doctorate degrees in the 2018-2019 academic year were California (5,241), New York (3,137), Texas (3,134), Massachusetts (2,502), and Pennsylvania (1,946). The map also shows that several other states in the Midwest, Atlantic coast, and Florida performed relatively well in terms of the total number of S&E PhDs awarded, while the Great Plains, Mountain West, and upper New England typically awarded fewer S&E PhDs in total.
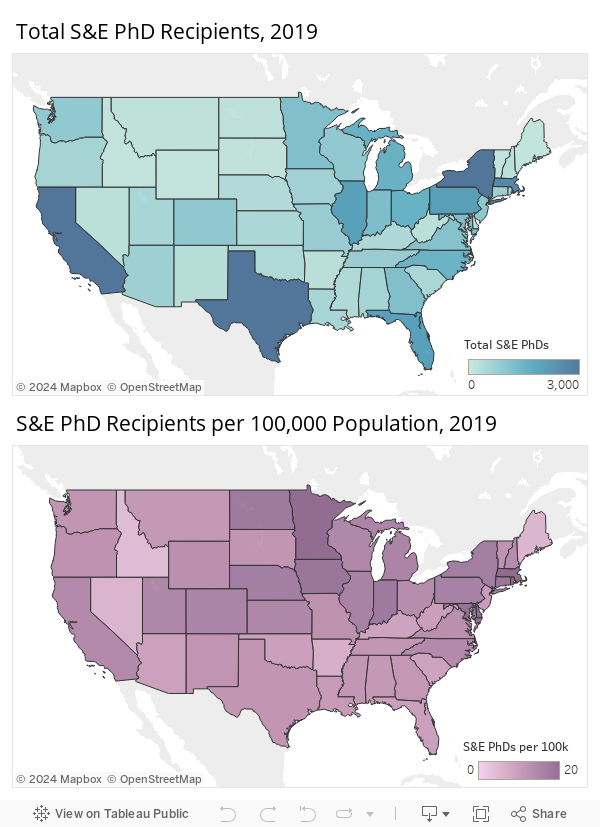
However, to assess how productive states are at producing S&E PhD recipients since the number of total recipients is likely closely linked to state populations and number of institutions of higher education, the second interactive map shows the number of S&E PhD recipients per 100,000 population in each state. Using this measure, the District of Columbia (53.7) ranks first, followed by Massachusetts (36.3), Rhode Island (24.7), Delaware (22), and Minnesota (19.8). The map shows that several states in the Midwest, mid-Atlantic Coast, and the Great Plains award more S&E PhDs relative to their population size.
While states like California and New York produce a significant portion of the highly educated segment of the S&E workforce, other states contribute more to this segment relative to their overall size.
Click here for a spreadsheet including the data used in SSTI’s analysis.