As the world begins to emerge from the “Great Lockdown” and governments increasingly turn their efforts towards reopening economies, many will look to past recessions for lessons on recovery. This edition of Useful Stats examines the rate of real GDP recovery by state following the recessions of 2001 and 2008.
According to their latest projections, the Congressional Budget Office expects that the U.S. economy will not recover from the current recession until after 2021. However, as seen after the recession in 2001 and again after the Great Recession of 2008, states recover at widely different rates. As shown in the map below, nearly every state had fully recovered to pre-recession levels of GDP within one year following the recession from March to November of 2001. Only three states took longer to recover — with Connecticut taking two years, and Delaware and New York both fully recovering after three years.

As the longest lasting recession since the Great Depression, the Great Recession had a significantly larger impact on state productivity than the 2001 recession, resulting in a national recovery that took three years to reach pre-recession level of real GDP. The following map shows that most states had fully recovered within three years. However, of these 31 states — shaded green in the map below — only seven states recovered after one year, 13 recovered after two years, and 11 more states took three years for recovery. Of the remaining 19 states, 12 took between four and six years to recover, five needed seven or more years, and three states — Connecticut, Mississippi, and Wyoming — had not yet recovered as of 2019.
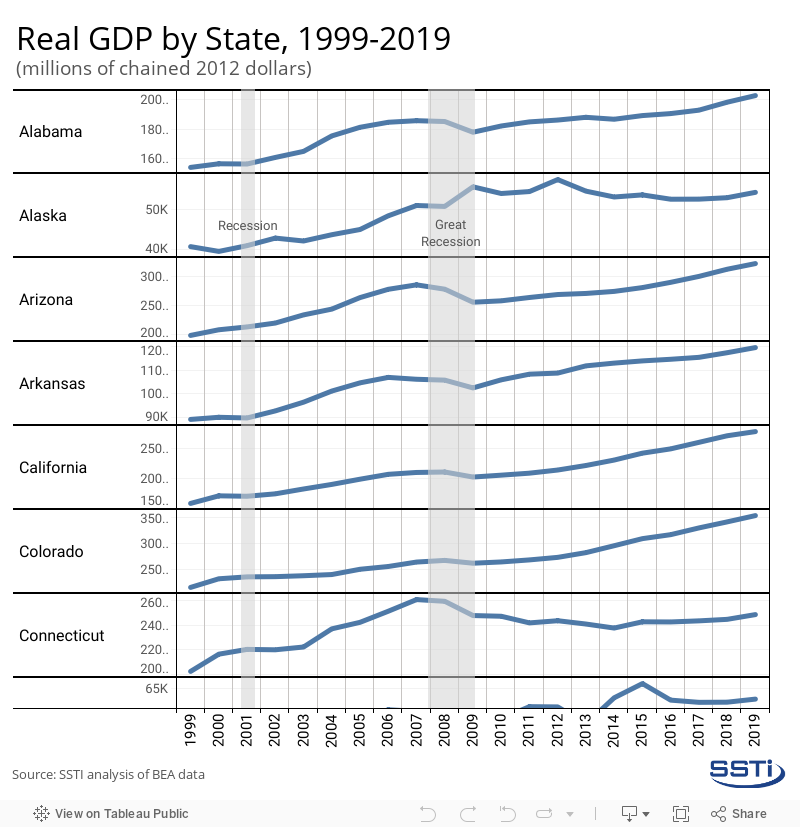
Most states took longer to recover after the Great Recession than after the 2001 recession. However, several states — Alaska, Nebraska, New Mexico, North Dakota, and South Dakota — recovered in the same amount of time after each recession, and two states recovered faster after the Great Recession than after 2001. Delaware and New York each took three years to recover after 2001 and both recovered after the Great Recession after just one year. The following interactive chart shows real GDP for each state from 1999 to 2019, and indicates when these two recessions occurred.
Forecasts are mixed in prediction for economic recovery from the current crisis. For example, Brookings and the Center on Budget and Policy Priorities caution that there are several possible patterns and timeframes for the coming recovery and refrain from making any concrete predictions. Meanwhile, the International Monetary Fund and Moody’s Analytics explicitly predict a speedier recovery from this recession than from the Great Recession. However, policymakers and elected officials must be wary of the assumptions made by any model on the timeframe for containing the pandemic and the lifting of lockdown restrictions, consider how their state and local economies differ from national patterns, and weigh their past recovery efforts against the unique conditions of the current recession.
An Excel workbook containing the data for this analysis can be accessed here.