Higher levels of business creation can be linked to the presence of innovation in a state through entrepreneurial activity and transitioning to new industries, and this edition of Useful Stats examines data from the Census Bureau’s recently updated Business Dynamics Statistics (BDS) on net establishment formation and the job creation stemming from those establishments in 2019. While figures vary widely among the states, most saw growth in both net establishment creation and net job creation in 2019; this data is prior to the onset of the pandemic in early 2020. This analysis also provides additional context by examining the long-term state trends in these metrics from 1978 to 2019.
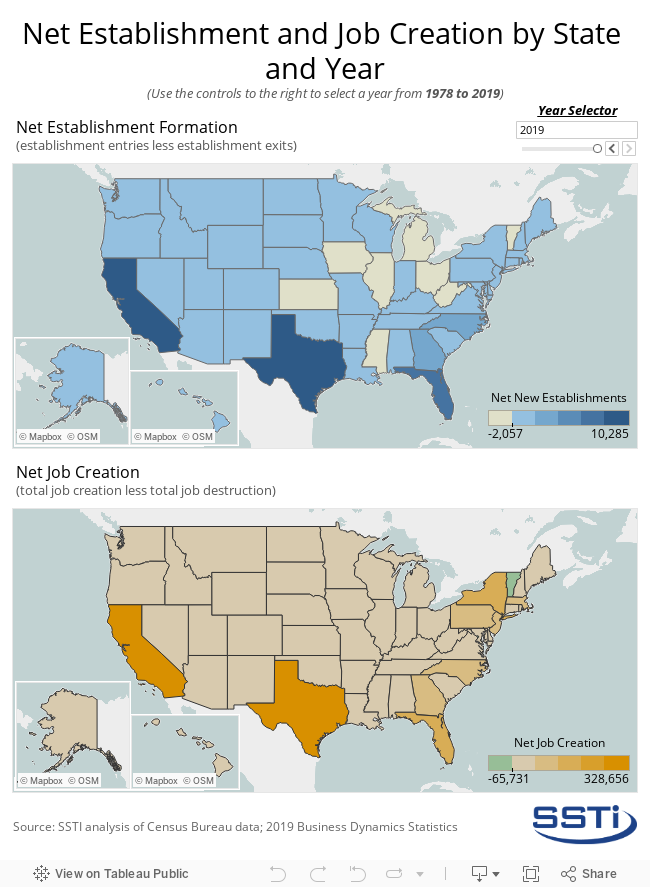
Net establishment formation is calculated as the difference between new establishment openings and establishment closures. Fewer states saw negative net establishment creation (total establishment losses) and negative net job creation (total job losses) in 2019 than in 2018. As seen in the first map below, the states that experienced the greatest levels of net establishment formation in 2019 were California (10,285); Texas (8,424); Florida (8,096); Georgia (2,861); and, North Carolina (2,359). The states that experienced net establishment losses in 2019 were Mississippi (-52); West Virginia (-108); Vermont (-141); Illinois (-160); Kansas (-181); Iowa (-224); Michigan (-352); and, Ohio (-747).
Net job creation is the difference between the jobs gained from existing plus new establishments and the jobs lost to existing plus closing establishments. The second map below shows that the states that experienced the greatest net job creation in 2019 were California (328,656); Texas (282,017); New York (172,017); Florida (158,268); and, Pennsylvania (84,660). The states that experienced the lowest net job creation — and a few that experienced a net loss — in 2019 were Rhode Island (2,266); West Virginia (749); South Dakota (150); Vermont (-1,155); and, the District of Columbia (-10,230).
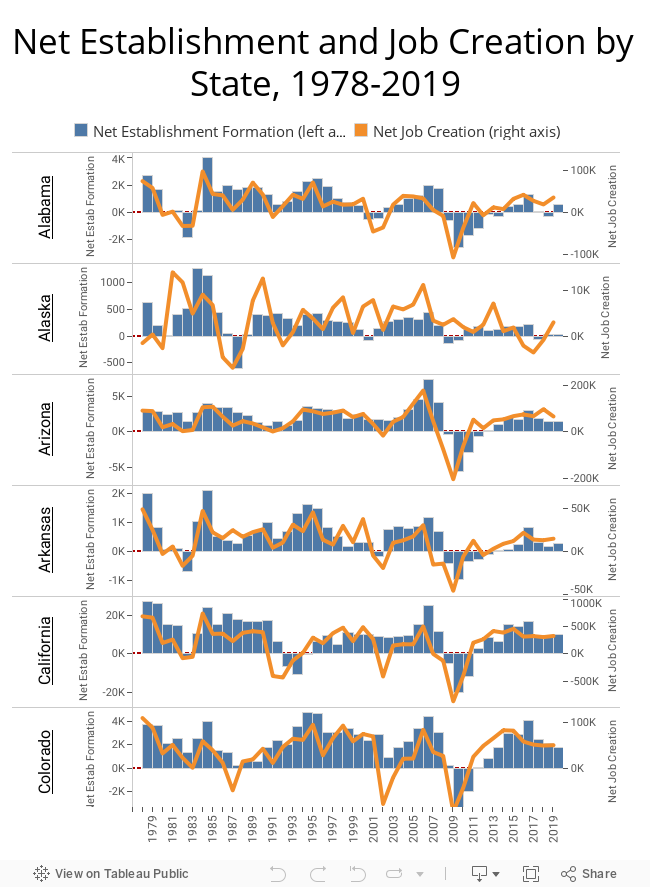
The image below provides the long-term trends in net establishment formation and job creation figures by state from 1978 to 2019. While the most recent BDS data ends with 2019 and does not capture the impacts of the Covid-19 pandemic and subsequent recession, this data does provide a long-term historical perspective that may prove helpful while more timely data are collected.
Both net establishment formation and job creation typically dip during recessions, although many states have been experiencing reductions in both measures for the last several years despite a generally hot economy. Other data shows that the 2020 recession drove increases in business startup activity, measured by business applications, at levels not seen in the previous 15 years. That data is more speculative in nature; the next BDS release for 2020 will show more accurately how the pandemic impacted real establishment formations and job creation.
Click here for the data used in this analysis.