Recession can drive increases in entrepreneurship as laid off workers look for other opportunities and start their own businesses. Increases in business startup activity throughout the 2020 recession were greater than any time in the 15 years prior. This edition of Useful Stats examines data from the Census Bureau’s Business Formation Statistics (BFS) series covering business initiation activity as indicated by applications for an Employer Identification Number (EIN). Specifically, this analysis examines high-propensity business applications (HBA*) per 1,000 residents per state — business applications that are associated with a high rate of business formation — for the 15-year period from 2006 to 2020.
Nationally in 2020, there were 4.6 HBA per 1,000 residents. As seen in the interactive image below, the states with the greatest number of HBA per 1,000 state residents in 2020 were Wyoming (12.2); Delaware (10.7); Florida (8.6); Georgia (7.6); and the District of Columbia (5.9). The states with the fewest number of high-propensity business applications per 1,000 state residents in 2020 were New Mexico (2.7); Kentucky (2.6); New Hampshire (2.6); Iowa (2.5); and West Virginia (2.1).
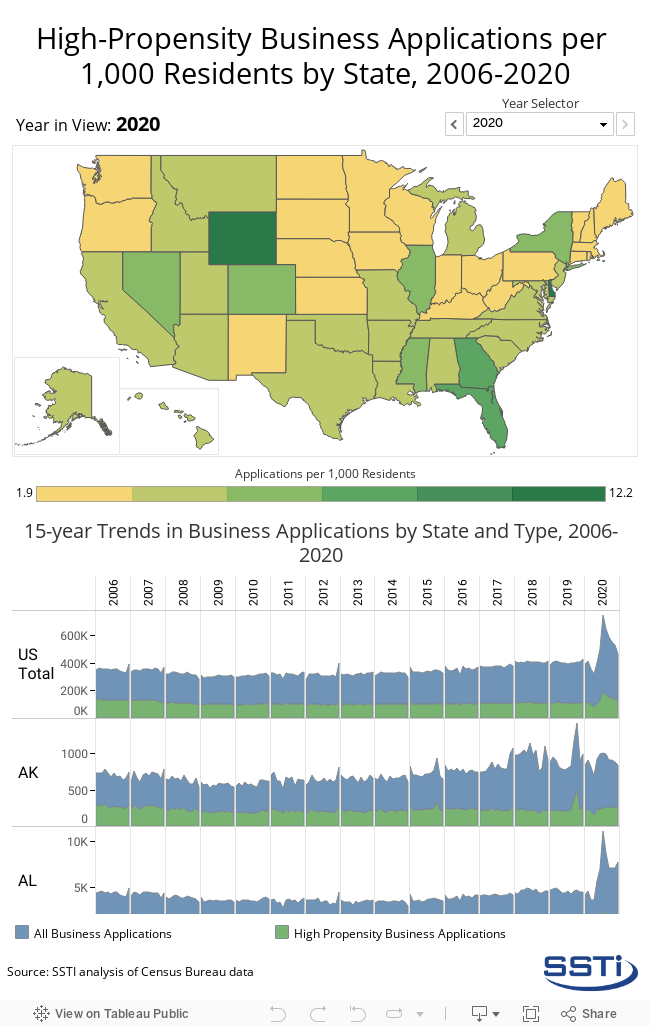
The charts below the map show the 15-year trends — as well as the split of all business applications compared to HBA — by state. While the trends in business applications in most states are similar to the national trend of explosive growth in 2020, several states were substantially different. For instance, Alaska, Idaho, North Dakota, New Hampshire, Rhode Island, South Dakota, and Vermont experienced spikes in business applications in the year or two before the 2020 pandemic and recession, while Hawaii, Iowa, Kansas, Maine, New Mexico, Oregon, and West Virginia experienced consistently higher levels of business applications per 1,000 residents in the decade before the 2020 recession and smaller spikes in business applications during the recession.
Click here for the data used in this analysis.
*HBA: High-Propensity Business Applications - Business Applications (BA) that have a high-propensity of turning into businesses with payroll. The identification of high-propensity applications is based on the characteristics of applications revealed on the IRS Form SS-4 that are associated with a high rate of business formation. High-propensity applications include applications: (a) from a corporate entity, (b) that indicate they are hiring employees, purchasing a business or changing organizational type, (c) that provide a first wages-paid date (planned wages); or (d) that have a NAICS industry code in manufacturing (31-33), a portion of retail (44), health care (62), or accommodation and food services (72).