

As the most comprehensive resource available for those involved in technology-based economic development, SSTI offers the services that are needed to help build tech-based economies. Learn more about membership...

Useful Stats: Higher Ed R&D expenditures and personnel in nonmetropolitan areas, 2019
Although the nation’s nonmetropolitan economies are less reliant on the R&D activity performed by institutions of higher education than the economies of urban areas, researchers in some rural areas show levels of higher education R&D (HERD) expenditures per R&D employee that are on par, or even exceed, their urban counterparts. Policy makers may wish to consider and prioritize the relative “outsized” importance of HERD funding and related research personnel in future policy decisions and public investments that are geared toward select smaller communities and rural places. For instance, innovation-oriented entrepreneurship concentrates around R&D-rich, knowledge centers, and this data indicates that there are non-metropolitan areas that fit that description.
However, despite the relative wealth of R&D resources and potential economic development opportunities in these nonmetropolitan research hotspots, it may be difficult to sustain vital TBED-related support functions in some smaller markets without public support. Public support may be required in these areas to make such locations sufficiently attractive for the private risk capital and innovation-based business acumen that can find economies of scale and profitability in metro markets.
Building on SSTI’s previous analyses of total HERD spending, HERD spending as a share of area GDP, and HERD personnel in the metropolitan areas of the United States, this week’s edition of Useful Stats examines these same measures for the country’s nonmetropolitan areas.
Higher ED R&D Expenditures
Previous SSTI analysis indicates that a majority of R&D expenditures at colleges and universities in 2019 were generated in metro areas. However, the following seven states experienced HERD expenditures in nonmetropolitan areas that were greater than 30 percent of the total HERD spending within the state: Wyoming (100 percent of total HERD spending in the state); South Dakota (88.3 percent); Mississippi (81.7 percent); New Hampshire (69.7 percent); Idaho (67.4 percent); Montana (61.7 percent); and, Oklahoma (34.5 percent).
As indicated by the darkest shades of blue in the interactive map below, the states that experienced the greatest total HERD expenditures in nonmetropolitan areas in 2019 were Mississippi ($437.8 million); New Hampshire ($343.2 million); Oklahoma ($184.3 million); Montana ($168.8 million); Idaho ($113.1 million); South Dakota ($104.6 million); and, Michigan ($100.2 million).
All other states experienced less than $81 million in nonmetropolitan HERD expenditures in 2019, and several states reported no nonmetropolitan HERD activity at all in 2019 (Arkansas, Connecticut, Delaware, Florida, Indiana, Massachusetts, Nevada, North Dakota, Rhode Island, Utah, Virginia, and West Virginia).
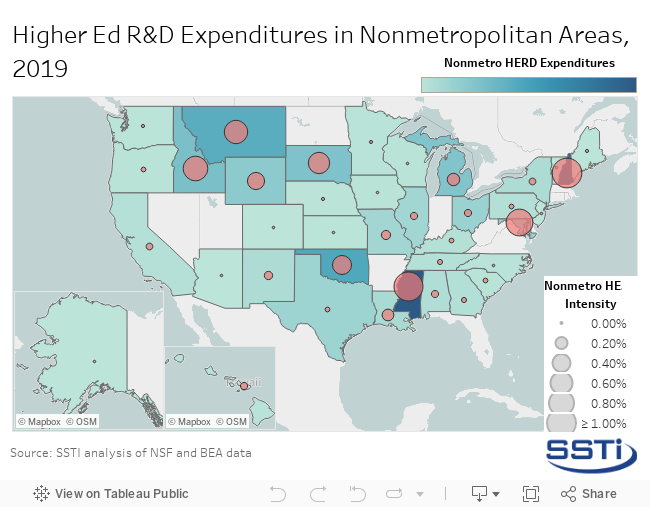
Presenting HERD expenditures as a share of the total GDP (HERD intensity) of the nonmetropolitan areas within states, the red bubbles in the map above show the relative importance of HERD activity across the nation’s nonmetropolitan economies. Previous SSTI analysis shows that economies in smaller metropolitan areas are more reliant on HERD spending than larger metros, but states show greater similarity in terms of nonmetropolitan HERD intensity — with every state experiencing nonmetropolitan HERD expenditures of less than 1.5 percent of area GDP in 2019. The states with the greatest nonmetropolitan HERD intensity were New Hampshire (1.3 percent of area GDP); Mississippi (1.0 percent); Maryland (0.8 percent); Idaho (0.7 percent); Montana (0.6 percent); and South Dakota (0.5 percent).
Higher Ed R&D Personnel
The R&D personnel at institutions of higher education — including Principal Investigators (PIs), graduate student and postdoctoral researchers, and other faculty and staff employed directly by R&D projects — in nonmetropolitan areas makes up roughly 3 percent of all R&D personnel at the nation’s universities and colleges. The shading in the map below indicates the total number of HERD personnel in the nonmetropolitan areas of each state. The states with the greatest nonmetropolitan HERD workforces in 2019 were Mississippi (6,412 R&D employees); Michigan (2,538 R&D employees); Idaho (2,447 R&D employees); Oklahoma (2,158 R&D employees); and, New Hampshire (2,028 R&D employees).
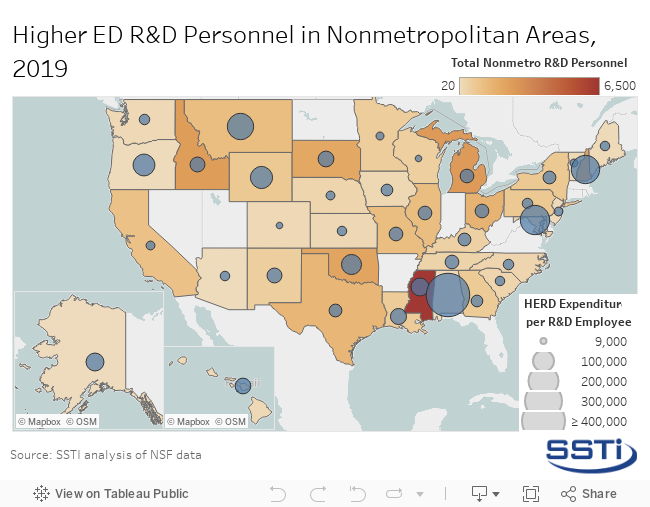
While there are fewer total HERD personnel working in nonmetropolitan areas than in the nation’s cities, these important drivers of local innovation are no less capable of attracting research funding than their metropolitan counterparts. The map above represents the amount of local HERD expenditures per each local HERD employee with the blue bubbles.
The states with the greatest HERD spending per R&D employee in 2019 were Alabama ($437,489 per R&D employee); Maryland ($181,925 per employee); New Hampshire ($169,232 per employee); Montana ($146,269 per employee); and, Wyoming ($103,017 per R&D employee).
Of these, several states performed particularly strong when also including metropolitan areas in the analysis. In terms of metropolitan and nonmetropolitan HERD expenditures per R&D employee, nonmetropolitan Alabama ranked 2nd overall, nonmetropolitan Maryland ranked 7th overall, New Hampshire ranked 8th overall, and Montana ranked 11th overall. The next closest ranked nonmetropolitan area was in Wyoming which ranked 43rd overall.
Click here for the Excel files used in this analysis.