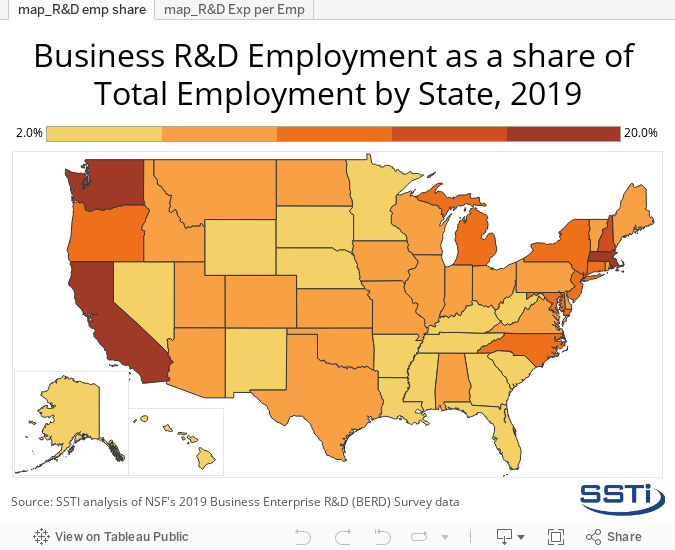
An SSTI analysis of business R&D employment data from the National Science Foundation’s recently updated 2019 Business Enterprise R&D (BERD) Survey finds that nationally in 2019, R&D employment at private businesses accounted for 8.6 percent of total employment. The states where the business R&D employment shares of total employment were the greatest in 2019 were Washington (20.9 percent); Massachusetts (19.3 percent); California (17.7 percent); New Hampshire (14.7 percent); and Michigan (12.7 percent). The analysis builds on our previous examination of business R&D expenditures and focuses on R&D employment at private businesses and the level of total business R&D expenditures per R&D employee by state in 2019.
The states where business R&D employment accounted for the lowest shares of total employment in 2019 were Tennessee (2.9 percent); Arkansas (2.7 percent); Mississippi (2.7 percent); Louisiana (2.3 percent); and, Hawaii (2.2 percent).
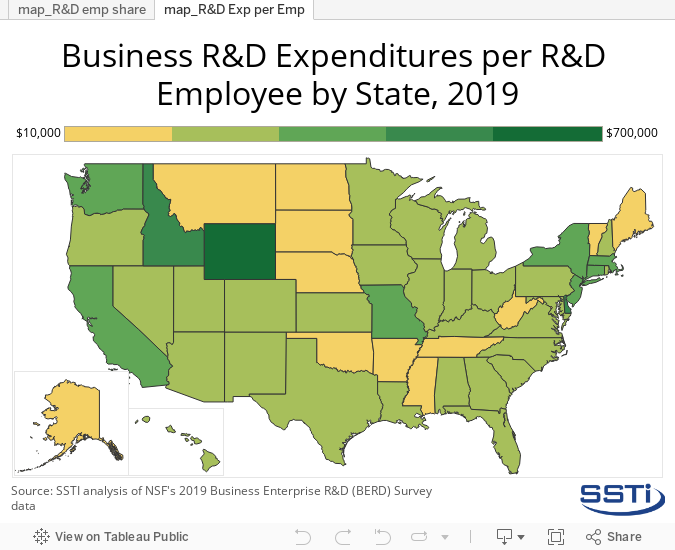
Nationally in 2019, businesses spent $269,081 per R&D employee. The states that had the greatest levels of business R&D expenditures per R&D employee in 2019 were Wyoming ($686,000); Idaho ($449,500); Delaware ($431,200); California ($420,443); and, Connecticut ($412,278).
The states with the lowest levels of R&D spending per R&D employee in 2019 were Mississippi ($108,000); Maine ($104,250); South Dakota ($97,000); Montana ($68,333); and, Alaska ($49,000).
Stay tuned for SSTI’s next edition of Useful Stats which will continue to examine business R&D expenditures through an analysis of R&D intensity — the measure of R&D’s share of Gross Domestic Product (GDP)— by state in 2019.
Click here for the data used in this analysis.