Understanding the industry-level dynamics of business and job creation can help pinpoint which industries in regional economies may be hotspots for innovation activity. This edition of Useful Stats builds on previous SSTI analysis of business and job creation by state and examines data from the Census Bureau’s recently updated Business Dynamics Statistics (BDS) on net establishment and job creation in 2019 at the state and industry levels.
Specifically, this analysis examines net establishment creation (calculated as the difference between new establishment openings and establishment closures) and net job creation (calculated as the difference between the jobs gained from existing plus new establishments and the jobs lost to existing plus closing establishments) at the 2-digit NAICS code level. The data serves as a useful baseline of where the economy stood prior to the pandemic’s start in 2020.
While the national data shows that five industries experienced net establishment losses in 2019, industry trends at the state level vary widely with some states seeing losses across many industries while others experienced losses in only a few. There were also similar national- and state-level trends in net job creation in 2019. This analysis also provides additional context by examining the long-term state trends in these metrics from 2005 to 2019.
Net establishment creation
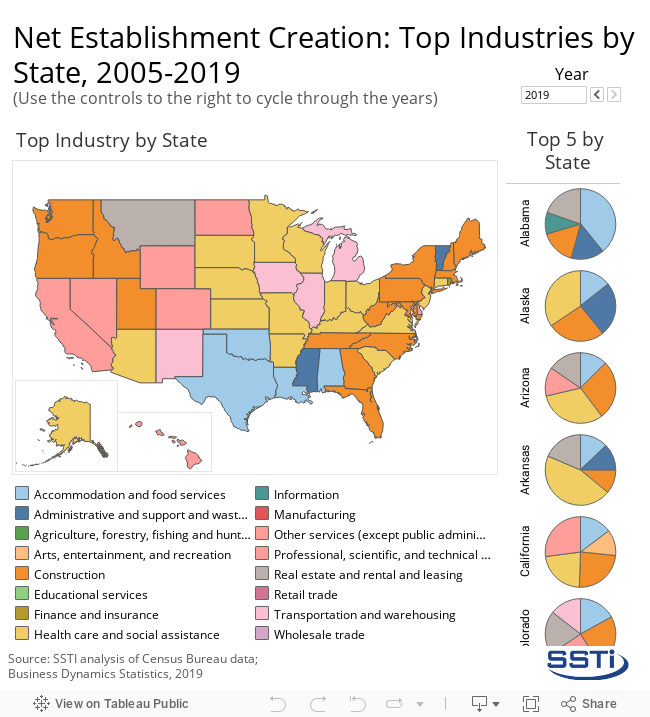
Nationally in 2019, the construction industry saw the greatest net establishment creation (12,810); followed by health care and social assistance (11,412); accommodation and food services (8,235); real estate and rental and leasing (6,119); and, transportation and warehousing (6,009). However, at the state level, there was some variation in which industries were the top performers in net establishment creation. As seen in the interactive graphic below, health care and social assistance experienced the greatest level of net establishment creation in the most number of states (16 states) in 2019; followed by construction (15 states); professional, scientific, and technical services (6 states); transportation and warehousing (4 states); and, accommodation and food services (4 states).
The pie charts on the right of the graphic below detail the top five industries in each state by net establishment creation. Use the “Year” controls in the interactive graphic to view the map and pie charts for each year in the 15-year period from 2005 to 2019. Also, hovering the cursor over a state in the map or over a chart segment will provide additional detail on the 15-year trend in net establishment creation (or losses) for the top industry in that state or chart segment.
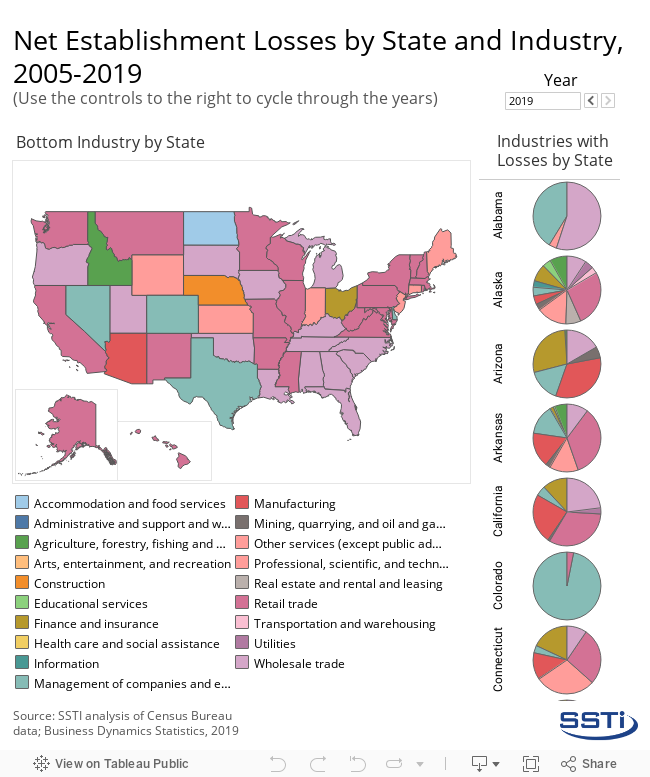
Nationally, five industries experienced net establishment losses in 2019. Those industries were mining, quarrying, and oil and gas extraction (21 establishments lost); management of companies and establishments (1,810 lost); manufacturing (2,476 lost); retail trade (3,811 lost); and, wholesale trade (4,005 establishments lost).
There was again some variation at the state level regarding which industries experienced the greatest net establishment losses in 2019. The map below shows which industries saw the most severe establishment losses in 2019 for each state, revealing that the industries lagging behind the most in net establishment creation in 2019 by state were: other services (ranked last in 3 states); professional, scientific, and technical services (3 states); management of companies and enterprises (4 states); wholesale trade (14 states); and, retail trade (ranked last in 22 states).
The pie charts on the right of the image below detail the industries in each state by those that experienced net establishment losses. Use the “Year” controls in the interactive graphic to view the map and pie charts for each year in the 15-year period from 2005 to 2019. Also, hovering the cursor over a state in the map or over a chart segment will provide additional detail on the 15-year trend in net establishment creation (or losses) for the top industry in that state or chart segment.
Net Job Creation
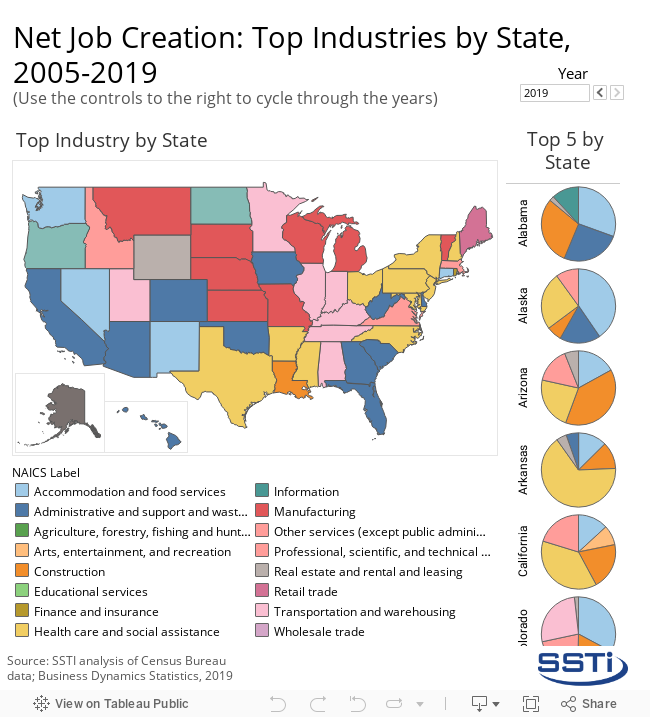
Nationally in 2019, the industries that experienced the greatest levels of net job creation were health care and social assistance (386,230 jobs gained); transportation and warehousing (372,100 jobs); administrative and support and waste management and remediation services (329,764 jobs); construction (222,242 jobs); and, manufacturing (218,539 jobs gained). Only the utilities industry experienced net job losses — amounting to 1,781 jobs.
As seen in the interactive graphic below, the industries that experienced the greatest levels of net job creation in the most number of states in 2019 were administrative and support and waste management and remediation services (ranked first in 11 states); health care and social assistance (10 states); manufacturing (8 states); transportation and warehousing (7 states); and, accommodation and food services (4 states). Hover over the parts of the interactive graphic to reveal the 15-year industry trends from 2005 to 2019.
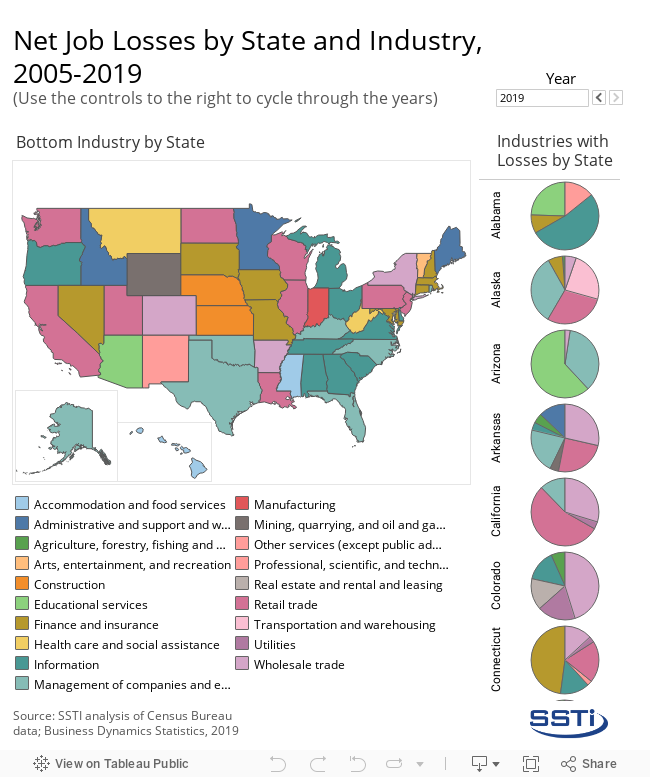
Although only the utilities industry saw national net job losses in 2019, every state had at least one industry that experienced net job losses for the year. The map in the interactive graphic below shows the industry that experienced the greatest net job losses in each state, and the pie charts shows every industry that experienced net job losses by state in 2019. Hovering over the parts of the interactive graphic reveals the 15-year industry trends from 2005 to 2019.
Click here for the data used in this analysis.