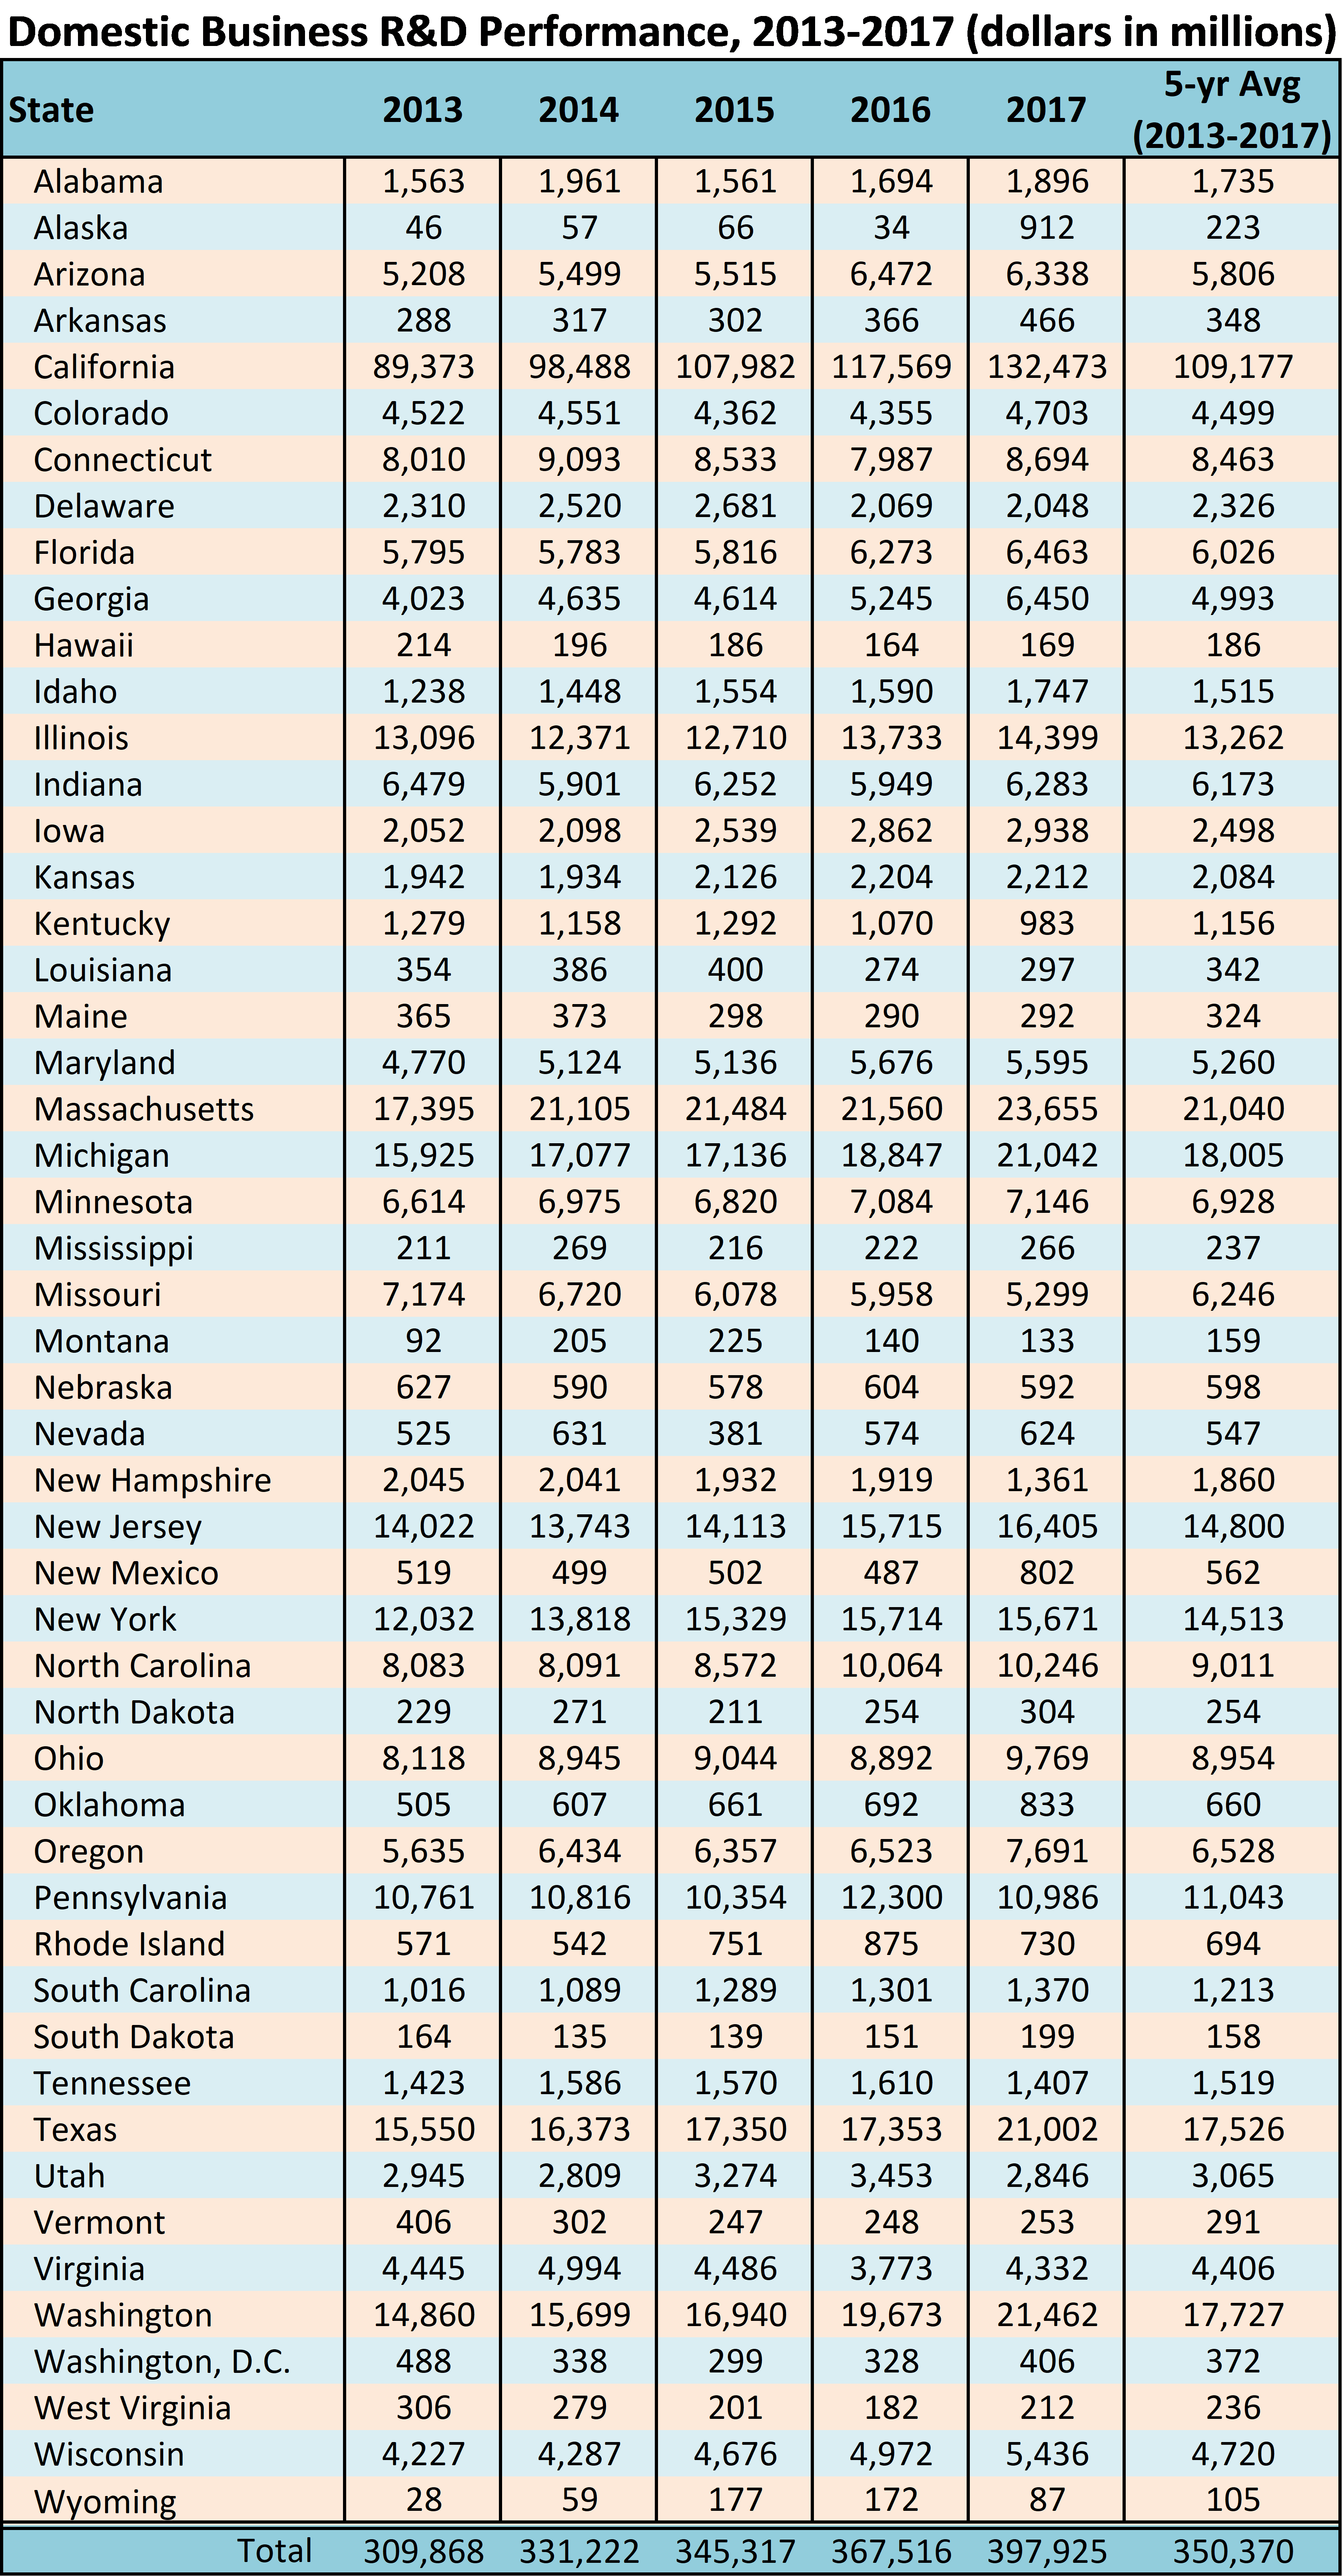
Business R&D activity has been historically concentrated in a few states and became even more so in 2017, according to a National Science Foundation issue brief on the latest Business Research & Development and Innovation Survey (BRDIS). Despite finding total business R&D surpassed $400 billion in 2017, reflecting a 6.8 percent increase over 2016 results, NSF’s data also reveals R&D activity in five states alone – California, Massachusetts, Michigan, Washington and Texas – captured well over half of all of the nation’s business R&D investment in 2017. These top states represented 55.2 percent of the total in 2017, while five years earlier their share was “only” 49.4 percent of the reported results.
Private sector investment into research and development is a critical component of innovation, new product development, and regional economic vitality. The continued gains in R&D activity in top performing states are offset by losses across other states, both in real dollars and in the share of the U.S. total. Thirteen states saw real dollar declines between 2016 and 2017; the 2017 figure in 15 states was below their five-year average. The growing concentration of business R&D presents policy challenges for national and state leaders concerned about the future economic vibrancy of large sections of the country (see figures below).
It should be noted that annual R&D investments by businesses could show great variability and fluctuation across years. The result can move a state several relative positions in comparison to other states from one year to the next, pointing to a significant weakness in using rankings to measure a state’s performance and a reason why SSTI doesn’t recommend using many rankings for innovation benchmarking or TBED policy development. For example, the data suggests Alaska experienced an $878 million increase between 2016 and 2017, a 2,580 percent increase. With no readily apparent explanation in the BRDIS data released so far by NSF, Alaska is excluded from SSTI's analysis. Movement up and down the table below is most noticeable as state totals decrease, given the long tail distribution of the amounts.

Each of the top five states surpassed $21 billion in total business R&D expenditures in 2017, a feat accomplished by only the top two states previously. The next five states – historically strong manufacturing states of New Jersey, New York, Illinois, Pennsylvania and North Carolina – exhibited between $10 billion and $16 billion in business R&D in 2017. Unlike their larger counterparts in the top five, two states in this second tier saw their totals decline.
The third grouping includes 10 states, while further tightening the range of total business R&D expenditures from $5 billion up to $9.8 billion. Eleven states have between $1 billion and $4.7 billion. The balance of 18 states and Washington, D.C., all have 2017 totals under $1 billion.
With very few exceptions, business R&D expenditures track closely with population and other NSF R&D expenditure surveys. For instance, all of the states with totals under $1 billion in 2017 also are among the least populated. The interactive map below presents the change in each states’ share of the total business performance during each of the five years between 2013 and 2017.
NSF has not yet released the full data tables for the 2017 BRDIS results, which may help explain some of the variability in year-to-year figures and to characterize the data by industry and to develop more complete pictures of each state’s R&D community. In coming weeks, SSTI will dive into the data deeper for Digest readers as it becomes available.