

-

Save the date for SSTI's 2024 Annual Conference
Join us December 10-12 in Arizona to connect with and learn from your peers working around the country to strengthen their regional innovation economies. Visit ssticonference.org for more information and sign up to receive updates.
-

As the most comprehensive resource available for those involved in technology-based economic development, SSTI offers the services that are needed to help build tech-based economies. Learn more about membership...
-

Subscribe to the SSTI Weekly Digest
Each week, the SSTI Weekly Digest delivers the latest breaking news and expert analysis of critical issues affecting the tech-based economic development community. Subscribe today!
Useful Stats: Higher Ed R&D Performance by Metro and Field


Taking a deeper dive into R&D expenditures at U.S. institutions of higher education, this week’s edition of Useful Stats examines the fields in which this R&D was performed at the metropolitan level in 2018. Expanding on a previous SSTI report showing that R&D activity at universities and colleges is clustered heavily on the coasts, this analysis uses the NSF’s Higher Education R&D (HERD) data on the research expenditures at individual institutions to determine how this funding is distributed among the various fields of study, with life sciences outpacing all other fields.
As shown in the interactive map below, HERD expenditures in the life sciences (primarily the biological, biomedical, and health sciences) accounted for the vast majority of all higher education R&D activity in the U.S. — accounting for 57.8 percent ($45.8 billion) of the total performed in 2018. Engineering R&D was a distant second, accounting for 15.6 of the total.
On average, HERD spending on life sciences within states accounted for 55.5 percent of total Higher Ed R&D expenditures and within metropolitan areas, HERD spending on life sciences averaged 43.6 percent of the total. Life sciences was the top field for research expenditures in 165 of the 256 metropolitan areas in this analysis.
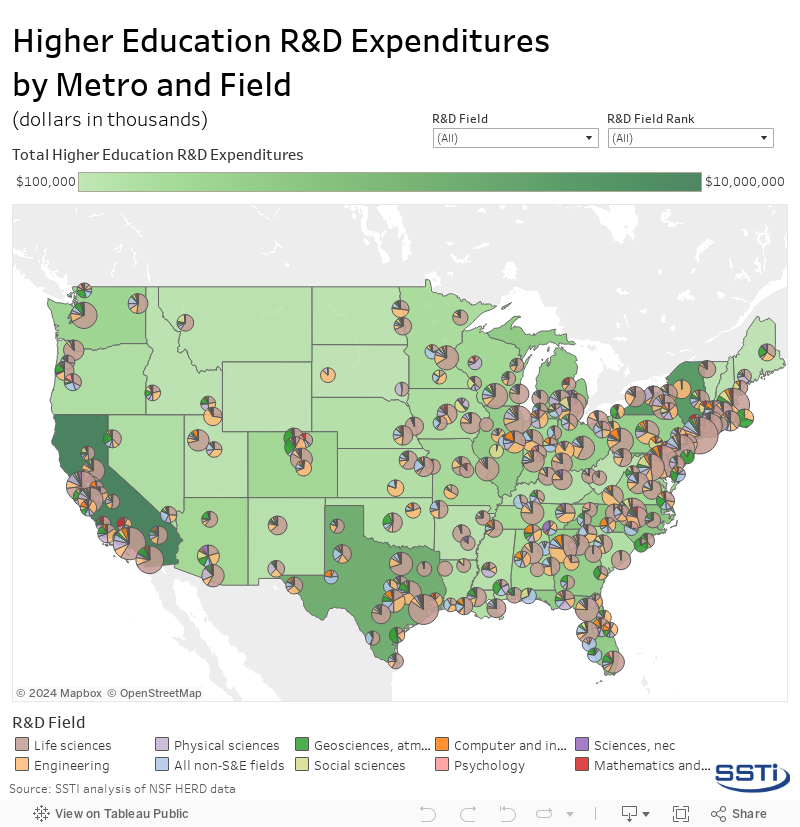
The top 10 metropolitan areas in total life sciences R&D expenditures during 2018 were New York ($3.4 billion), Houston ($2 billion), Los Angeles ($1.9 billion), San Francisco ($1.8 billion), Durham-Chapel Hill ($1.8 billion), Philadelphia ($1.6 billion), Baltimore ($1.4 billion), Boston ($1.3 billion), Chicago ($1.3 billion), and San Diego ($1.2 billion). Performance of life sciences R&D in all other metropolitan areas was less than $1 billion each in 2018.
However, none of the above metropolitan areas fall within the top 10 in terms of the share of total metro HERD expenditures in life sciences. That is, while the above metro areas had the greatest amount of money spent in life sciences R&D, the concentration of R&D expenditures in the life sciences were typically lower in these cities since larger cities with more diverse economies and multiple institutions garner additional available funding across other fields of study.
In fact, only Houston (84.2 percent), Durham-Chapel Hill (77.7 percent), San Francisco (73.2 percent), and New York (71.7 percent) are in the top 50 metropolitan areas in terms of the concentration of life sciences HERD performance. Baltimore (44.4 percent) and Boston (37.4 percent) are in the bottom half of metro areas in concentration of life sciences expenditures. Of the metro areas where life sciences R&D accounted for 75 percent or more of total HERD expenditures (40 metros in total), the average amount spent was $298 million. Excluding the outliers of Houston and Chapel Hill where expenditures in this field exceeded $1 billion, the average amount spent on life sciences Higher Ed R&D was $214 million.
The field accounting for the second highest share of HERD expenditures in 2018 was engineering — totaling 15.6 percent ($12.4 billion) of all Higher Ed R&D spending in 2018. On average, HERD spending on engineering within states accounted for 15.3 percent of the total Higher Ed R&D expenditures. Within metropolitan areas, it averaged 17.9 percent of the total. Engineering was the top field for research in 50 metro areas.
The only metropolitan area that spent more than $1 billion on engineering R&D in 2018 was Baltimore ($1.1 billion). The other metros that had the greatest amount of engineering R&D performance were Boston ($753 million), Atlanta ($620 million), New York ($420 million), State College, Pennsylvania ($325 million), College Station, Texas ($301 million), Ann Arbor ($299 million), Los Angeles ($293 million), Utica-Rome, New York ($255 million), and Austin, Texas ($247 million). Of the metro areas that spent 75 percent or more on engineering R&D (five metros in total), the average expenditure was $108 million.
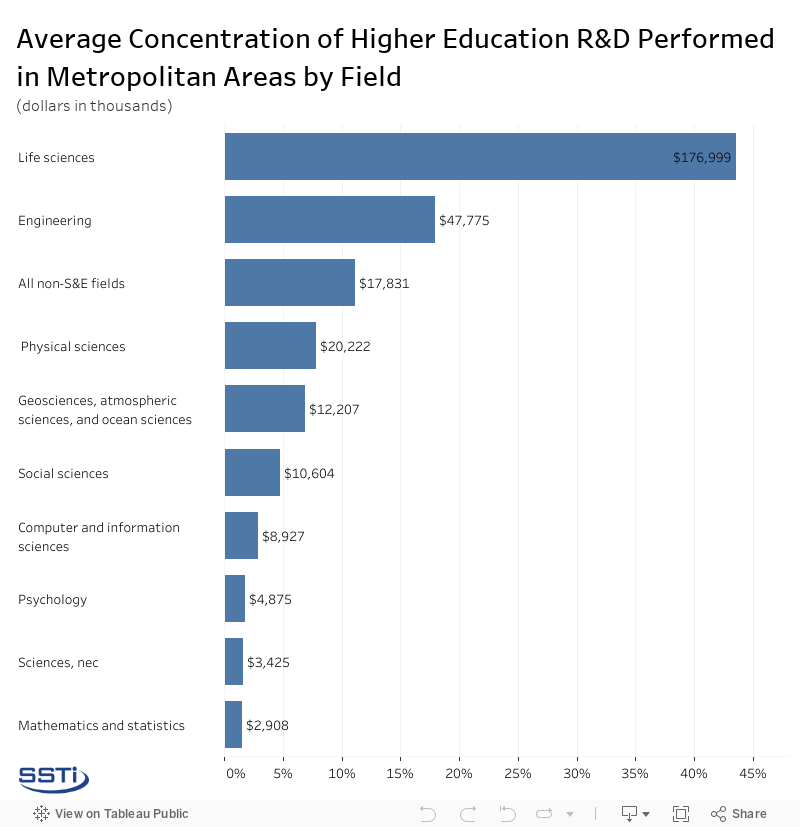
The rest of the fields combined — physical sciences (6.6 percent and $5.2 billion), non-S&E fields* (5.8 percent and $4.6 billion), geosciences, atmospheric and ocean sciences (4 percent and $3.2 billion), social sciences (3.5 percent and $2.7 billion), computer and information sciences (3 percent and $2.4 billion), psychology (1.6 percent and $1.3 billion), all other sciences (1.1 percent and $887 million), and mathematics and statistics (0.9 percent and $753 million) — accounted for less than 30 percent of the total U.S. HERD expenditures in 2018. This information is summarized at the metro level in the chart below.
SSTI’s analysis of the NSF data is also included here in an excel file.
*Non-S&E field includes law, business and management, humanities, education, visual and performing arts, social work, communications and journalism.
higher ed, r&d, metros, useful stats